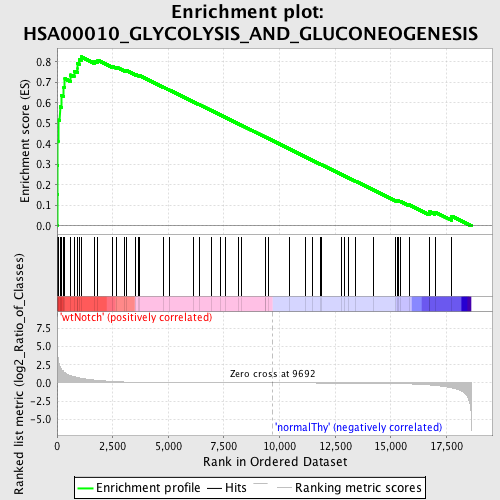
Profile of the Running ES Score & Positions of GeneSet Members on the Rank Ordered List
| Dataset | Set_03_wtNotch_versus_normalThy.phenotype_wtNotch_versus_normalThy.cls #wtNotch_versus_normalThy.phenotype_wtNotch_versus_normalThy.cls #wtNotch_versus_normalThy_repos |
| Phenotype | phenotype_wtNotch_versus_normalThy.cls#wtNotch_versus_normalThy_repos |
| Upregulated in class | wtNotch |
| GeneSet | HSA00010_GLYCOLYSIS_AND_GLUCONEOGENESIS |
| Enrichment Score (ES) | 0.8249211 |
| Normalized Enrichment Score (NES) | 1.747118 |
| Nominal p-value | 0.0 |
| FDR q-value | 0.014773089 |
| FWER p-Value | 0.015 |
| PROBE | DESCRIPTION (from dataset) | GENE SYMBOL | GENE_TITLE | RANK IN GENE LIST | RANK METRIC SCORE | RUNNING ES | CORE ENRICHMENT | |
|---|---|---|---|---|---|---|---|---|
| 1 | PGK1 | 1570494 630300 | 8 | 5.004 | 0.1544 | Yes | ||
| 2 | PFKM | 1990156 5720168 | 21 | 4.511 | 0.2933 | Yes | ||
| 3 | PKM2 | 6520403 70500 | 34 | 3.793 | 0.4099 | Yes | ||
| 4 | TPI1 | 1500215 2100154 | 44 | 3.470 | 0.5168 | Yes | ||
| 5 | ALDH1B1 | 610195 | 129 | 2.245 | 0.5817 | Yes | ||
| 6 | ADH5 | 6290100 6380711 | 190 | 1.860 | 0.6360 | Yes | ||
| 7 | ENO3 | 5270136 | 302 | 1.532 | 0.6774 | Yes | ||
| 8 | ALDOA | 6290672 | 351 | 1.397 | 0.7180 | Yes | ||
| 9 | FBP1 | 1470762 | 594 | 1.016 | 0.7364 | Yes | ||
| 10 | LDHA | 2190594 | 764 | 0.880 | 0.7546 | Yes | ||
| 11 | HK2 | 2640722 | 915 | 0.752 | 0.7697 | Yes | ||
| 12 | PFKL | 6200167 | 918 | 0.751 | 0.7929 | Yes | ||
| 13 | ENO1 | 5340128 | 992 | 0.689 | 0.8102 | Yes | ||
| 14 | ALDH2 | 4230019 | 1086 | 0.637 | 0.8249 | Yes | ||
| 15 | PDHA1 | 5550397 | 1693 | 0.392 | 0.8044 | No | ||
| 16 | PGAM1 | 2570133 | 1830 | 0.354 | 0.8080 | No | ||
| 17 | DLAT | 430452 | 2471 | 0.202 | 0.7798 | No | ||
| 18 | DLD | 4150403 6590341 | 2678 | 0.169 | 0.7739 | No | ||
| 19 | ALDH3A1 | 580095 | 3025 | 0.128 | 0.7592 | No | ||
| 20 | PFKP | 70138 6760040 1170278 | 3109 | 0.120 | 0.7585 | No | ||
| 21 | PGAM2 | 3610605 | 3544 | 0.082 | 0.7376 | No | ||
| 22 | LDHC | 2030458 6100463 | 3664 | 0.073 | 0.7335 | No | ||
| 23 | GAPDH | 110022 430039 6220161 | 3708 | 0.070 | 0.7333 | No | ||
| 24 | ALDH3B1 | 4210010 6940403 | 4764 | 0.032 | 0.6775 | No | ||
| 25 | ADHFE1 | 1990673 6840022 | 5073 | 0.026 | 0.6617 | No | ||
| 26 | ADH7 | 60465 | 6135 | 0.015 | 0.6050 | No | ||
| 27 | ALDH7A1 | 4050446 | 6395 | 0.013 | 0.5915 | No | ||
| 28 | FBP2 | 1580193 | 6917 | 0.010 | 0.5637 | No | ||
| 29 | PGM1 | 3840408 | 7359 | 0.008 | 0.5402 | No | ||
| 30 | ACYP1 | 6380403 | 7571 | 0.007 | 0.5291 | No | ||
| 31 | ADH4 | 6840301 | 8160 | 0.005 | 0.4975 | No | ||
| 32 | ALDH9A1 | 4810047 | 8266 | 0.005 | 0.4920 | No | ||
| 33 | ALDH1A3 | 2100270 | 9369 | 0.001 | 0.4327 | No | ||
| 34 | PKLR | 1170400 2470114 | 9380 | 0.001 | 0.4322 | No | ||
| 35 | GAPDHS | 2690463 | 9513 | 0.001 | 0.4251 | No | ||
| 36 | ACYP2 | 2510605 | 10459 | -0.002 | 0.3743 | No | ||
| 37 | PGM3 | 2570465 | 11173 | -0.005 | 0.3360 | No | ||
| 38 | GCK | 2370273 | 11474 | -0.006 | 0.3200 | No | ||
| 39 | PDHA2 | 2630438 | 11844 | -0.007 | 0.3003 | No | ||
| 40 | ALDOB | 4730324 | 11882 | -0.007 | 0.2986 | No | ||
| 41 | LDHAL6B | 5130280 | 12784 | -0.012 | 0.2504 | No | ||
| 42 | G6PC2 | 1660114 5220070 | 12917 | -0.013 | 0.2437 | No | ||
| 43 | HK1 | 4280402 | 13116 | -0.015 | 0.2335 | No | ||
| 44 | PGK2 | 2650091 | 13408 | -0.017 | 0.2183 | No | ||
| 45 | G6PC | 430093 | 14224 | -0.029 | 0.1754 | No | ||
| 46 | ALDOC | 450121 610427 | 15231 | -0.069 | 0.1233 | No | ||
| 47 | ADH1A | 3170427 | 15283 | -0.072 | 0.1228 | No | ||
| 48 | ACSS2 | 1780435 3170224 | 15340 | -0.076 | 0.1221 | No | ||
| 49 | BPGM | 5080520 | 15423 | -0.083 | 0.1202 | No | ||
| 50 | HK3 | 3190288 6510142 | 15822 | -0.124 | 0.1026 | No | ||
| 51 | ENO2 | 2320068 | 16742 | -0.273 | 0.0616 | No | ||
| 52 | PDHB | 70215 610086 | 16745 | -0.273 | 0.0699 | No | ||
| 53 | GALM | 730368 | 16985 | -0.335 | 0.0674 | No | ||
| 54 | ACSS1 | 6580037 | 17725 | -0.659 | 0.0480 | No |

