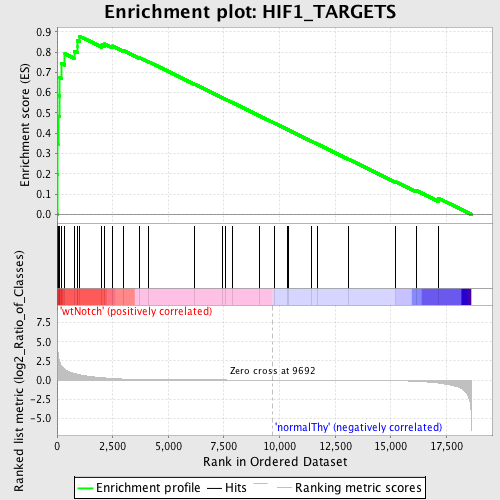
Profile of the Running ES Score & Positions of GeneSet Members on the Rank Ordered List
| Dataset | Set_03_wtNotch_versus_normalThy.phenotype_wtNotch_versus_normalThy.cls #wtNotch_versus_normalThy.phenotype_wtNotch_versus_normalThy.cls #wtNotch_versus_normalThy_repos |
| Phenotype | phenotype_wtNotch_versus_normalThy.cls#wtNotch_versus_normalThy_repos |
| Upregulated in class | wtNotch |
| GeneSet | HIF1_TARGETS |
| Enrichment Score (ES) | 0.87864166 |
| Normalized Enrichment Score (NES) | 1.660518 |
| Nominal p-value | 0.0 |
| FDR q-value | 0.03346427 |
| FWER p-Value | 0.241 |
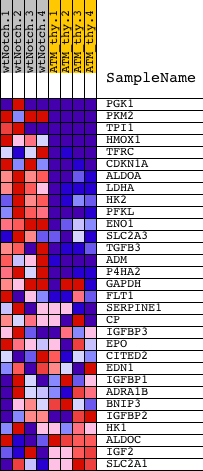
| PROBE | DESCRIPTION (from dataset) | GENE SYMBOL | GENE_TITLE | RANK IN GENE LIST | RANK METRIC SCORE | RUNNING ES | CORE ENRICHMENT | |
|---|---|---|---|---|---|---|---|---|
| 1 | PGK1 | 1570494 630300 | 8 | 5.004 | 0.1977 | Yes | ||
| 2 | PKM2 | 6520403 70500 | 34 | 3.793 | 0.3466 | Yes | ||
| 3 | TPI1 | 1500215 2100154 | 44 | 3.470 | 0.4835 | Yes | ||
| 4 | HMOX1 | 1740687 | 92 | 2.622 | 0.5849 | Yes | ||
| 5 | TFRC | 4050551 | 123 | 2.289 | 0.6739 | Yes | ||
| 6 | CDKN1A | 4050088 6400706 | 188 | 1.874 | 0.7447 | Yes | ||
| 7 | ALDOA | 6290672 | 351 | 1.397 | 0.7913 | Yes | ||
| 8 | LDHA | 2190594 | 764 | 0.880 | 0.8040 | Yes | ||
| 9 | HK2 | 2640722 | 915 | 0.752 | 0.8257 | Yes | ||
| 10 | PFKL | 6200167 | 918 | 0.751 | 0.8553 | Yes | ||
| 11 | ENO1 | 5340128 | 992 | 0.689 | 0.8786 | Yes | ||
| 12 | SLC2A3 | 1990377 | 2016 | 0.304 | 0.8357 | No | ||
| 13 | TGFB3 | 1070041 | 2137 | 0.274 | 0.8401 | No | ||
| 14 | ADM | 4810121 | 2472 | 0.202 | 0.8301 | No | ||
| 15 | P4HA2 | 1090546 | 2978 | 0.132 | 0.8081 | No | ||
| 16 | GAPDH | 110022 430039 6220161 | 3708 | 0.070 | 0.7717 | No | ||
| 17 | FLT1 | 3830167 4920438 | 4096 | 0.050 | 0.7528 | No | ||
| 18 | SERPINE1 | 4210403 | 6157 | 0.015 | 0.6426 | No | ||
| 19 | CP | 2570484 | 7415 | 0.008 | 0.5753 | No | ||
| 20 | IGFBP3 | 2370500 | 7579 | 0.007 | 0.5668 | No | ||
| 21 | EPO | 940180 | 7898 | 0.006 | 0.5499 | No | ||
| 22 | CITED2 | 5670114 5130088 | 9116 | 0.002 | 0.4845 | No | ||
| 23 | EDN1 | 1770047 | 9775 | -0.000 | 0.4491 | No | ||
| 24 | IGFBP1 | 5720435 | 10359 | -0.002 | 0.4178 | No | ||
| 25 | ADRA1B | 2100484 | 10409 | -0.002 | 0.4153 | No | ||
| 26 | BNIP3 | 3140270 | 11417 | -0.006 | 0.3613 | No | ||
| 27 | IGFBP2 | 5220563 | 11715 | -0.007 | 0.3456 | No | ||
| 28 | HK1 | 4280402 | 13116 | -0.015 | 0.2708 | No | ||
| 29 | ALDOC | 450121 610427 | 15231 | -0.069 | 0.1598 | No | ||
| 30 | IGF2 | 6510020 | 16150 | -0.170 | 0.1172 | No | ||
| 31 | SLC2A1 | 2100609 | 17145 | -0.391 | 0.0791 | No |