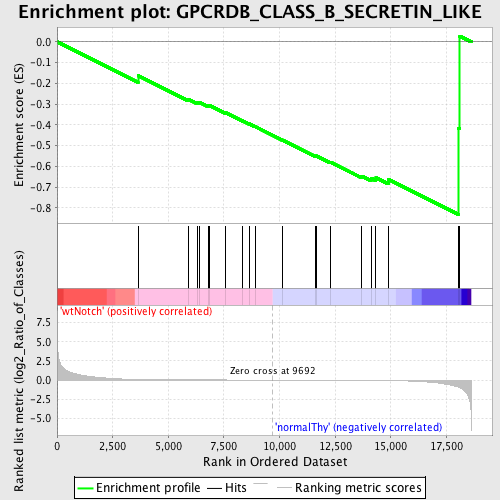
Profile of the Running ES Score & Positions of GeneSet Members on the Rank Ordered List
| Dataset | Set_03_wtNotch_versus_normalThy.phenotype_wtNotch_versus_normalThy.cls #wtNotch_versus_normalThy.phenotype_wtNotch_versus_normalThy.cls #wtNotch_versus_normalThy_repos |
| Phenotype | phenotype_wtNotch_versus_normalThy.cls#wtNotch_versus_normalThy_repos |
| Upregulated in class | normalThy |
| GeneSet | GPCRDB_CLASS_B_SECRETIN_LIKE |
| Enrichment Score (ES) | -0.83139014 |
| Normalized Enrichment Score (NES) | -1.5251373 |
| Nominal p-value | 0.010570824 |
| FDR q-value | 0.35028836 |
| FWER p-Value | 0.999 |
| PROBE | DESCRIPTION (from dataset) | GENE SYMBOL | GENE_TITLE | RANK IN GENE LIST | RANK METRIC SCORE | RUNNING ES | CORE ENRICHMENT | |
|---|---|---|---|---|---|---|---|---|
| 1 | SCTR | 2940070 | 3641 | 0.075 | -0.1625 | No | ||
| 2 | ELTD1 | 3120086 | 5916 | 0.017 | -0.2772 | No | ||
| 3 | EMR1 | 70136 1500592 | 6319 | 0.014 | -0.2927 | No | ||
| 4 | GPR64 | 4610692 5220471 | 6386 | 0.013 | -0.2903 | No | ||
| 5 | PTHR1 | 2640711 3360647 | 6793 | 0.011 | -0.3073 | No | ||
| 6 | PTHR2 | 510121 | 6831 | 0.011 | -0.3046 | No | ||
| 7 | GLP2R | 4150577 5290273 7050095 | 7590 | 0.007 | -0.3422 | No | ||
| 8 | GLP1R | 6420528 | 8327 | 0.004 | -0.3798 | No | ||
| 9 | VIPR2 | 6520050 | 8636 | 0.003 | -0.3948 | No | ||
| 10 | GHRHR | 3130500 4010154 | 8915 | 0.002 | -0.4087 | No | ||
| 11 | ADCYAP1R1 | 3390020 4280184 5360180 | 10113 | -0.001 | -0.4725 | No | ||
| 12 | GCGR | 6620497 | 11619 | -0.006 | -0.5507 | No | ||
| 13 | LPHN2 | 4480010 | 11649 | -0.006 | -0.5494 | No | ||
| 14 | CALCR | 1690494 | 12280 | -0.009 | -0.5792 | No | ||
| 15 | CRHR1 | 450161 3140070 5390647 | 13697 | -0.021 | -0.6462 | No | ||
| 16 | CRHR2 | 4590672 | 14113 | -0.027 | -0.6564 | No | ||
| 17 | CALCRL | 4280035 | 14331 | -0.032 | -0.6539 | No | ||
| 18 | VIPR1 | 2480292 5720288 6760537 | 14890 | -0.050 | -0.6617 | Yes | ||
| 19 | CD97 | 1090673 1690575 | 18046 | -0.935 | -0.4154 | Yes | ||
| 20 | LPHN1 | 1400113 3130301 | 18101 | -1.002 | 0.0277 | Yes |

