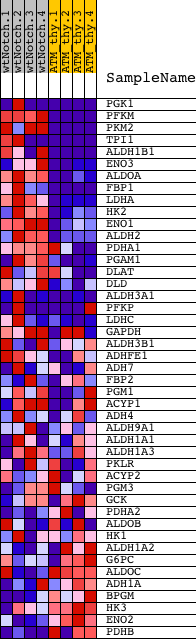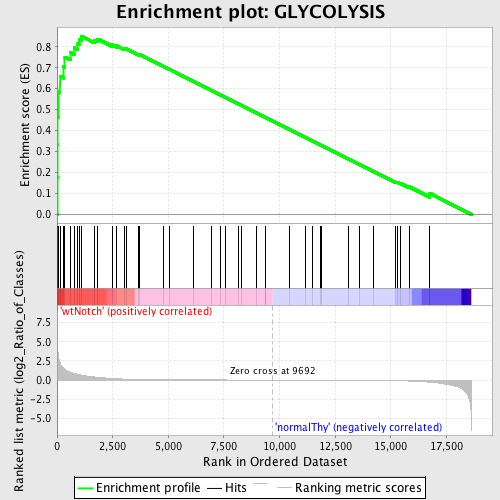
Profile of the Running ES Score & Positions of GeneSet Members on the Rank Ordered List
| Dataset | Set_03_wtNotch_versus_normalThy.phenotype_wtNotch_versus_normalThy.cls #wtNotch_versus_normalThy.phenotype_wtNotch_versus_normalThy.cls #wtNotch_versus_normalThy_repos |
| Phenotype | phenotype_wtNotch_versus_normalThy.cls#wtNotch_versus_normalThy_repos |
| Upregulated in class | wtNotch |
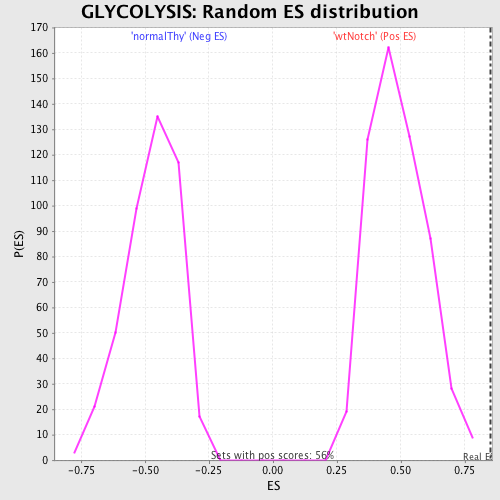
| GeneSet | GLYCOLYSIS |
| Enrichment Score (ES) | 0.850845 |
| Normalized Enrichment Score (NES) | 1.7394295 |
| Nominal p-value | 0.0 |
| FDR q-value | 0.009883553 |
| FWER p-Value | 0.02 |
| PROBE | DESCRIPTION (from dataset) | GENE SYMBOL | GENE_TITLE | RANK IN GENE LIST | RANK METRIC SCORE | RUNNING ES | CORE ENRICHMENT | |
|---|---|---|---|---|---|---|---|---|
| 1 | PGK1 | 1570494 630300 | 8 | 5.004 | 0.1750 | Yes | ||
| 2 | PFKM | 1990156 5720168 | 21 | 4.511 | 0.3324 | Yes | ||
| 3 | PKM2 | 6520403 70500 | 34 | 3.793 | 0.4648 | Yes | ||
| 4 | TPI1 | 1500215 2100154 | 44 | 3.470 | 0.5859 | Yes | ||
| 5 | ALDH1B1 | 610195 | 129 | 2.245 | 0.6601 | Yes | ||
| 6 | ENO3 | 5270136 | 302 | 1.532 | 0.7045 | Yes | ||
| 7 | ALDOA | 6290672 | 351 | 1.397 | 0.7509 | Yes | ||
| 8 | FBP1 | 1470762 | 594 | 1.016 | 0.7735 | Yes | ||
| 9 | LDHA | 2190594 | 764 | 0.880 | 0.7952 | Yes | ||
| 10 | HK2 | 2640722 | 915 | 0.752 | 0.8135 | Yes | ||
| 11 | ENO1 | 5340128 | 992 | 0.689 | 0.8335 | Yes | ||
| 12 | ALDH2 | 4230019 | 1086 | 0.637 | 0.8508 | Yes | ||
| 13 | PDHA1 | 5550397 | 1693 | 0.392 | 0.8320 | No | ||
| 14 | PGAM1 | 2570133 | 1830 | 0.354 | 0.8370 | No | ||
| 15 | DLAT | 430452 | 2471 | 0.202 | 0.8097 | No | ||
| 16 | DLD | 4150403 6590341 | 2678 | 0.169 | 0.8045 | No | ||
| 17 | ALDH3A1 | 580095 | 3025 | 0.128 | 0.7903 | No | ||
| 18 | PFKP | 70138 6760040 1170278 | 3109 | 0.120 | 0.7901 | No | ||
| 19 | LDHC | 2030458 6100463 | 3664 | 0.073 | 0.7628 | No | ||
| 20 | GAPDH | 110022 430039 6220161 | 3708 | 0.070 | 0.7629 | No | ||
| 21 | ALDH3B1 | 4210010 6940403 | 4764 | 0.032 | 0.7072 | No | ||
| 22 | ADHFE1 | 1990673 6840022 | 5073 | 0.026 | 0.6916 | No | ||
| 23 | ADH7 | 60465 | 6135 | 0.015 | 0.6350 | No | ||
| 24 | FBP2 | 1580193 | 6917 | 0.010 | 0.5933 | No | ||
| 25 | PGM1 | 3840408 | 7359 | 0.008 | 0.5698 | No | ||
| 26 | ACYP1 | 6380403 | 7571 | 0.007 | 0.5587 | No | ||
| 27 | ADH4 | 6840301 | 8160 | 0.005 | 0.5272 | No | ||
| 28 | ALDH9A1 | 4810047 | 8266 | 0.005 | 0.5217 | No | ||
| 29 | ALDH1A1 | 6520706 | 8981 | 0.002 | 0.4834 | No | ||
| 30 | ALDH1A3 | 2100270 | 9369 | 0.001 | 0.4626 | No | ||
| 31 | PKLR | 1170400 2470114 | 9380 | 0.001 | 0.4621 | No | ||
| 32 | ACYP2 | 2510605 | 10459 | -0.002 | 0.4041 | No | ||
| 33 | PGM3 | 2570465 | 11173 | -0.005 | 0.3659 | No | ||
| 34 | GCK | 2370273 | 11474 | -0.006 | 0.3499 | No | ||
| 35 | PDHA2 | 2630438 | 11844 | -0.007 | 0.3303 | No | ||
| 36 | ALDOB | 4730324 | 11882 | -0.007 | 0.3286 | No | ||
| 37 | HK1 | 4280402 | 13116 | -0.015 | 0.2627 | No | ||
| 38 | ALDH1A2 | 2320301 | 13576 | -0.019 | 0.2386 | No | ||
| 39 | G6PC | 430093 | 14224 | -0.029 | 0.2048 | No | ||
| 40 | ALDOC | 450121 610427 | 15231 | -0.069 | 0.1531 | No | ||
| 41 | ADH1A | 3170427 | 15283 | -0.072 | 0.1528 | No | ||
| 42 | BPGM | 5080520 | 15423 | -0.083 | 0.1483 | No | ||
| 43 | HK3 | 3190288 6510142 | 15822 | -0.124 | 0.1312 | No | ||
| 44 | ENO2 | 2320068 | 16742 | -0.273 | 0.0913 | No | ||
| 45 | PDHB | 70215 610086 | 16745 | -0.273 | 0.1007 | No |