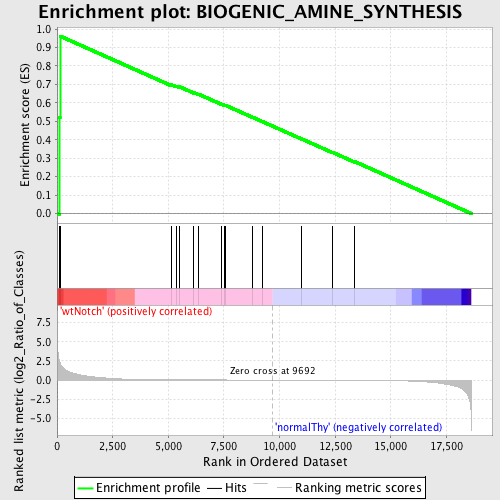
Profile of the Running ES Score & Positions of GeneSet Members on the Rank Ordered List
| Dataset | Set_03_wtNotch_versus_normalThy.phenotype_wtNotch_versus_normalThy.cls #wtNotch_versus_normalThy.phenotype_wtNotch_versus_normalThy.cls #wtNotch_versus_normalThy_repos |
| Phenotype | phenotype_wtNotch_versus_normalThy.cls#wtNotch_versus_normalThy_repos |
| Upregulated in class | wtNotch |
| GeneSet | BIOGENIC_AMINE_SYNTHESIS |
| Enrichment Score (ES) | 0.96177185 |
| Normalized Enrichment Score (NES) | 1.6408678 |
| Nominal p-value | 0.0 |
| FDR q-value | 0.04926433 |
| FWER p-Value | 0.357 |
| PROBE | DESCRIPTION (from dataset) | GENE SYMBOL | GENE_TITLE | RANK IN GENE LIST | RANK METRIC SCORE | RUNNING ES | CORE ENRICHMENT | |
|---|---|---|---|---|---|---|---|---|
| 1 | DDC | 670408 | 93 | 2.618 | 0.5204 | Yes | ||
| 2 | COMT | 360687 510577 5700092 | 133 | 2.210 | 0.9618 | Yes | ||
| 3 | SLC18A3 | 3060035 | 5125 | 0.026 | 0.6986 | No | ||
| 4 | MAOA | 1410039 4610324 | 5355 | 0.023 | 0.6909 | No | ||
| 5 | TH | 2100056 | 5511 | 0.021 | 0.6867 | No | ||
| 6 | CHAT | 6840603 | 6142 | 0.015 | 0.6559 | No | ||
| 7 | GAD2 | 1400088 | 6372 | 0.013 | 0.6463 | No | ||
| 8 | PNMT | 4210563 | 7379 | 0.008 | 0.5938 | No | ||
| 9 | AANAT | 610609 | 7540 | 0.007 | 0.5867 | No | ||
| 10 | DBH | 3610458 | 7581 | 0.007 | 0.5860 | No | ||
| 11 | HDC | 4150463 | 8791 | 0.003 | 0.5216 | No | ||
| 12 | GAD1 | 2360035 3140167 | 9223 | 0.001 | 0.4987 | No | ||
| 13 | PAH | 3800309 | 10985 | -0.004 | 0.4048 | No | ||
| 14 | TPH1 | 780180 | 12363 | -0.010 | 0.3327 | No | ||
| 15 | ACHE | 5290750 | 13360 | -0.017 | 0.2826 | No |

