Profile of the Running ES Score & Positions of GeneSet Members on the Rank Ordered List
| Dataset | Set_03_truncNotch_versus_wtNotch.phenotype_truncNotch_versus_wtNotch.cls #truncNotch_versus_wtNotch |
| Phenotype | phenotype_truncNotch_versus_wtNotch.cls#truncNotch_versus_wtNotch |
| Upregulated in class | truncNotch |
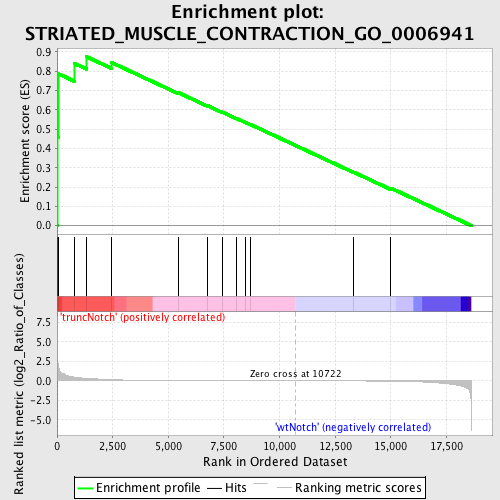
| GeneSet | STRIATED_MUSCLE_CONTRACTION_GO_0006941 |
| Enrichment Score (ES) | 0.8745754 |
| Normalized Enrichment Score (NES) | 1.507791 |
| Nominal p-value | 0.010434783 |
| FDR q-value | 0.6368833 |
| FWER p-Value | 1.0 |
| PROBE | DESCRIPTION (from dataset) | GENE SYMBOL | GENE_TITLE | RANK IN GENE LIST | RANK METRIC SCORE | RUNNING ES | CORE ENRICHMENT | |
|---|---|---|---|---|---|---|---|---|
| 1 | SRI | 3390446 4850064 | 34 | 2.378 | 0.4578 | Yes | ||
| 2 | PGAM2 | 3610605 | 62 | 1.709 | 0.7867 | Yes | ||
| 3 | ALDOA | 6290672 | 779 | 0.478 | 0.8406 | Yes | ||
| 4 | GAA | 520035 | 1330 | 0.329 | 0.8746 | Yes | ||
| 5 | ATP2A1 | 110309 | 2443 | 0.159 | 0.8454 | No | ||
| 6 | MYBPC3 | 650390 | 5436 | 0.027 | 0.6899 | No | ||
| 7 | MYOM1 | 580091 | 6756 | 0.015 | 0.6218 | No | ||
| 8 | SMPX | 6590440 | 7422 | 0.011 | 0.5882 | No | ||
| 9 | MYBPH | 2190711 | 8041 | 0.008 | 0.5566 | No | ||
| 10 | TTN | 2320161 4670056 6550026 | 8482 | 0.007 | 0.5342 | No | ||
| 11 | MYL2 | 70471 | 8696 | 0.006 | 0.5239 | No | ||
| 12 | CASQ2 | 3170136 | 13329 | -0.010 | 0.2770 | No | ||
| 13 | DTNA | 1340600 1780731 2340278 2850132 | 14995 | -0.037 | 0.1946 | No |

