Profile of the Running ES Score & Positions of GeneSet Members on the Rank Ordered List
| Dataset | Set_03_truncNotch_versus_wtNotch.phenotype_truncNotch_versus_wtNotch.cls #truncNotch_versus_wtNotch |
| Phenotype | phenotype_truncNotch_versus_wtNotch.cls#truncNotch_versus_wtNotch |
| Upregulated in class | truncNotch |
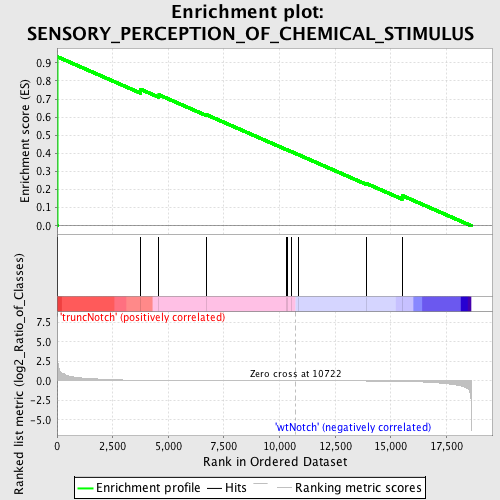
| GeneSet | SENSORY_PERCEPTION_OF_CHEMICAL_STIMULUS |
| Enrichment Score (ES) | 0.93325496 |
| Normalized Enrichment Score (NES) | 1.5402472 |
| Nominal p-value | 0.0018621974 |
| FDR q-value | 0.6422814 |
| FWER p-Value | 0.995 |
| PROBE | DESCRIPTION (from dataset) | GENE SYMBOL | GENE_TITLE | RANK IN GENE LIST | RANK METRIC SCORE | RUNNING ES | CORE ENRICHMENT | |
|---|---|---|---|---|---|---|---|---|
| 1 | GNAS | 630441 1850373 4050152 | 19 | 2.879 | 0.9333 | Yes | ||
| 2 | TAS1R1 | 430148 | 3750 | 0.066 | 0.7542 | No | ||
| 3 | OMP | 540364 | 4577 | 0.042 | 0.7234 | No | ||
| 4 | RTP3 | 2260176 | 6712 | 0.015 | 0.6136 | No | ||
| 5 | SLIT2 | 1940037 | 10303 | 0.001 | 0.4211 | No | ||
| 6 | TAS1R3 | 360136 | 10372 | 0.001 | 0.4177 | No | ||
| 7 | TAS1R2 | 4850072 | 10534 | 0.001 | 0.4092 | No | ||
| 8 | C5AR1 | 4540402 | 10869 | -0.000 | 0.3914 | No | ||
| 9 | OR1D2 | 3130333 | 13914 | -0.016 | 0.2329 | No | ||
| 10 | CYB5R4 | 2260601 4610450 | 15508 | -0.061 | 0.1670 | No |

