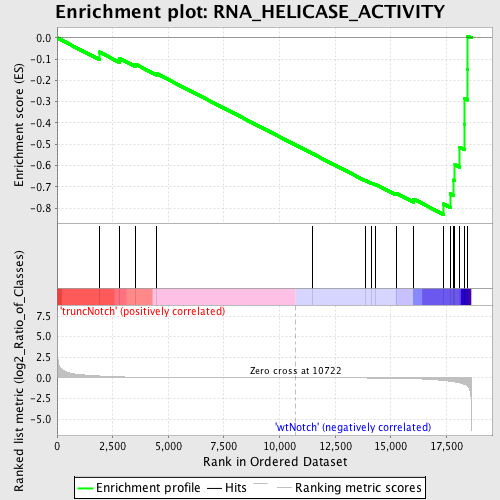
Profile of the Running ES Score & Positions of GeneSet Members on the Rank Ordered List
| Dataset | Set_03_truncNotch_versus_wtNotch.phenotype_truncNotch_versus_wtNotch.cls #truncNotch_versus_wtNotch |
| Phenotype | phenotype_truncNotch_versus_wtNotch.cls#truncNotch_versus_wtNotch |
| Upregulated in class | wtNotch |
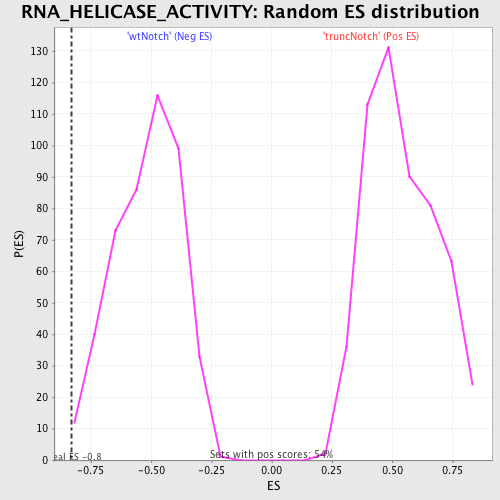
| GeneSet | RNA_HELICASE_ACTIVITY |
| Enrichment Score (ES) | -0.83017004 |
| Normalized Enrichment Score (NES) | -1.6062379 |
| Nominal p-value | 0.010869565 |
| FDR q-value | 0.22755913 |
| FWER p-Value | 0.9 |
| PROBE | DESCRIPTION (from dataset) | GENE SYMBOL | GENE_TITLE | RANK IN GENE LIST | RANK METRIC SCORE | RUNNING ES | CORE ENRICHMENT | |
|---|---|---|---|---|---|---|---|---|
| 1 | DDX54 | 6220324 | 1894 | 0.232 | -0.0664 | No | ||
| 2 | EIF4A3 | 3440538 | 2814 | 0.122 | -0.0972 | No | ||
| 3 | G3BP1 | 4780373 7100450 7100576 | 3533 | 0.075 | -0.1243 | No | ||
| 4 | DHX16 | 940044 | 4473 | 0.045 | -0.1679 | No | ||
| 5 | DDX10 | 520746 | 11484 | -0.002 | -0.5445 | No | ||
| 6 | UPF1 | 430164 1190750 | 13859 | -0.015 | -0.6699 | No | ||
| 7 | DHX9 | 60017 1170095 2260014 | 14145 | -0.018 | -0.6824 | No | ||
| 8 | DDX56 | 2030195 | 14319 | -0.021 | -0.6885 | No | ||
| 9 | DHX8 | 6100139 | 15240 | -0.047 | -0.7308 | No | ||
| 10 | SKIV2L | 3780278 4570092 | 16024 | -0.098 | -0.7579 | No | ||
| 11 | DDX6 | 2630025 6770408 | 17369 | -0.323 | -0.7807 | Yes | ||
| 12 | DDX3X | 2190020 | 17682 | -0.421 | -0.7330 | Yes | ||
| 13 | DHX38 | 780243 | 17809 | -0.469 | -0.6681 | Yes | ||
| 14 | DDX20 | 3290348 | 17882 | -0.495 | -0.5962 | Yes | ||
| 15 | DDX18 | 6980619 | 18090 | -0.610 | -0.5141 | Yes | ||
| 16 | DDX1 | 3450047 | 18318 | -0.784 | -0.4064 | Yes | ||
| 17 | DDX21 | 6100446 | 18324 | -0.788 | -0.2861 | Yes | ||
| 18 | DHX15 | 870632 | 18439 | -0.952 | -0.1466 | Yes | ||
| 19 | DDX25 | 5910121 | 18464 | -1.020 | 0.0082 | Yes |