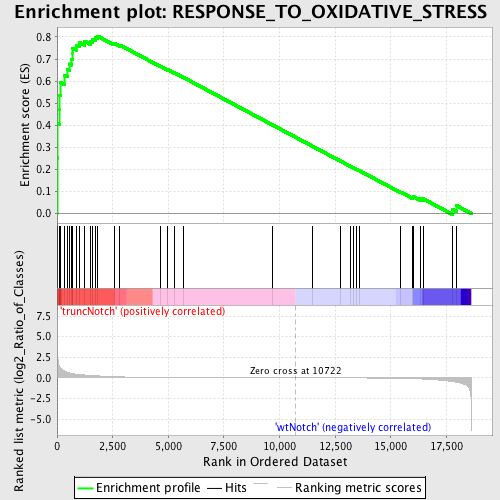
Profile of the Running ES Score & Positions of GeneSet Members on the Rank Ordered List
| Dataset | Set_03_truncNotch_versus_wtNotch.phenotype_truncNotch_versus_wtNotch.cls #truncNotch_versus_wtNotch |
| Phenotype | phenotype_truncNotch_versus_wtNotch.cls#truncNotch_versus_wtNotch |
| Upregulated in class | truncNotch |
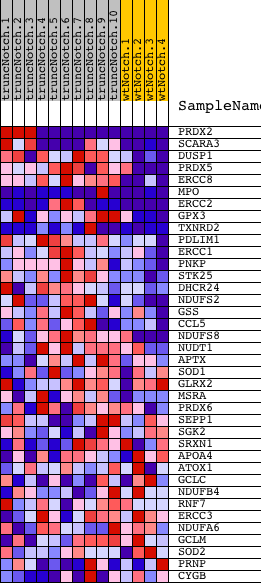
| GeneSet | RESPONSE_TO_OXIDATIVE_STRESS |
| Enrichment Score (ES) | 0.80398893 |
| Normalized Enrichment Score (NES) | 1.6985863 |
| Nominal p-value | 0.0017699115 |
| FDR q-value | 0.21199836 |
| FWER p-Value | 0.216 |
| PROBE | DESCRIPTION (from dataset) | GENE SYMBOL | GENE_TITLE | RANK IN GENE LIST | RANK METRIC SCORE | RUNNING ES | CORE ENRICHMENT | |
|---|---|---|---|---|---|---|---|---|
| 1 | PRDX2 | 6760095 4010619 5340577 | 2 | 4.972 | 0.2521 | Yes | ||
| 2 | SCARA3 | 5890487 | 16 | 3.084 | 0.4079 | Yes | ||
| 3 | DUSP1 | 6860121 | 115 | 1.337 | 0.4705 | Yes | ||
| 4 | PRDX5 | 1660592 2030091 | 120 | 1.290 | 0.5357 | Yes | ||
| 5 | ERCC8 | 1240300 6450372 6590180 | 145 | 1.176 | 0.5941 | Yes | ||
| 6 | MPO | 2360176 2760440 5690176 | 323 | 0.849 | 0.6276 | Yes | ||
| 7 | ERCC2 | 2360750 4060390 6550138 | 470 | 0.657 | 0.6531 | Yes | ||
| 8 | GPX3 | 1340450 | 566 | 0.585 | 0.6776 | Yes | ||
| 9 | TXNRD2 | 2510398 3780451 | 654 | 0.529 | 0.6998 | Yes | ||
| 10 | PDLIM1 | 450100 | 696 | 0.511 | 0.7235 | Yes | ||
| 11 | ERCC1 | 3800010 4590132 4670397 | 699 | 0.510 | 0.7492 | Yes | ||
| 12 | PNKP | 4610685 5720605 | 859 | 0.447 | 0.7634 | Yes | ||
| 13 | STK25 | 1090519 1500193 | 1008 | 0.398 | 0.7756 | Yes | ||
| 14 | DHCR24 | 840600 1050672 6290097 | 1243 | 0.346 | 0.7806 | Yes | ||
| 15 | NDUFS2 | 4850020 6200402 | 1511 | 0.292 | 0.7810 | Yes | ||
| 16 | GSS | 6130465 6900398 | 1608 | 0.274 | 0.7897 | Yes | ||
| 17 | CCL5 | 3710397 | 1721 | 0.258 | 0.7968 | Yes | ||
| 18 | NDUFS8 | 4150100 | 1817 | 0.243 | 0.8040 | Yes | ||
| 19 | NUDT1 | 2850600 | 2557 | 0.148 | 0.7717 | No | ||
| 20 | APTX | 3360041 4560167 | 2823 | 0.121 | 0.7636 | No | ||
| 21 | SOD1 | 5890070 | 4644 | 0.040 | 0.6677 | No | ||
| 22 | GLRX2 | 940433 | 4976 | 0.034 | 0.6516 | No | ||
| 23 | MSRA | 4570411 | 5256 | 0.030 | 0.6381 | No | ||
| 24 | PRDX6 | 4920397 6380601 | 5682 | 0.024 | 0.6164 | No | ||
| 25 | SEPP1 | 450273 | 9682 | 0.003 | 0.4013 | No | ||
| 26 | SGK2 | 1850070 | 11458 | -0.002 | 0.3059 | No | ||
| 27 | SRXN1 | 630731 3130195 4480239 | 12725 | -0.007 | 0.2381 | No | ||
| 28 | APOA4 | 4120451 | 13198 | -0.010 | 0.2132 | No | ||
| 29 | ATOX1 | 1090497 | 13322 | -0.010 | 0.2071 | No | ||
| 30 | GCLC | 2810731 | 13467 | -0.011 | 0.1999 | No | ||
| 31 | NDUFB4 | 460348 5690594 | 13581 | -0.012 | 0.1945 | No | ||
| 32 | RNF7 | 2030242 | 15454 | -0.057 | 0.0966 | No | ||
| 33 | ERCC3 | 6900008 | 15992 | -0.095 | 0.0726 | No | ||
| 34 | NDUFA6 | 3990348 | 16032 | -0.099 | 0.0755 | No | ||
| 35 | GCLM | 4230270 | 16319 | -0.127 | 0.0665 | No | ||
| 36 | SOD2 | 1410053 | 16447 | -0.142 | 0.0669 | No | ||
| 37 | PRNP | 3140687 | 17774 | -0.451 | 0.0184 | No | ||
| 38 | CYGB | 870347 | 17941 | -0.529 | 0.0363 | No |