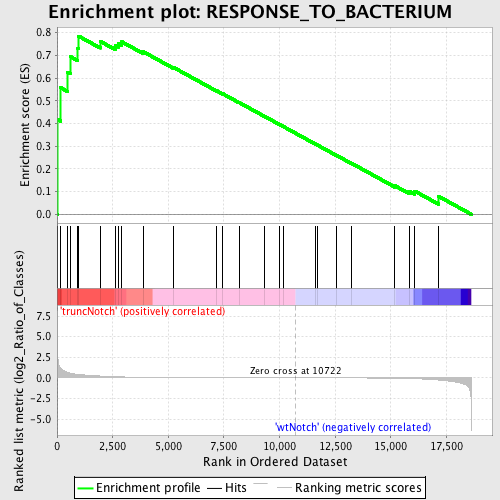
Profile of the Running ES Score & Positions of GeneSet Members on the Rank Ordered List
| Dataset | Set_03_truncNotch_versus_wtNotch.phenotype_truncNotch_versus_wtNotch.cls #truncNotch_versus_wtNotch |
| Phenotype | phenotype_truncNotch_versus_wtNotch.cls#truncNotch_versus_wtNotch |
| Upregulated in class | truncNotch |
| GeneSet | RESPONSE_TO_BACTERIUM |
| Enrichment Score (ES) | 0.7844765 |
| Normalized Enrichment Score (NES) | 1.5428314 |
| Nominal p-value | 0.014035088 |
| FDR q-value | 0.70421195 |
| FWER p-Value | 0.995 |
| PROBE | DESCRIPTION (from dataset) | GENE SYMBOL | GENE_TITLE | RANK IN GENE LIST | RANK METRIC SCORE | RUNNING ES | CORE ENRICHMENT | |
|---|---|---|---|---|---|---|---|---|
| 1 | SLC11A1 | 940286 2810435 6370647 | 15 | 3.189 | 0.4177 | Yes | ||
| 2 | CAMP | 6290735 | 160 | 1.123 | 0.5573 | Yes | ||
| 3 | PGLYRP2 | 2340086 | 475 | 0.654 | 0.6263 | Yes | ||
| 4 | NOD1 | 2360368 | 589 | 0.568 | 0.6947 | Yes | ||
| 5 | PGLYRP1 | 6760242 | 929 | 0.423 | 0.7320 | Yes | ||
| 6 | CFP | 2100619 | 965 | 0.414 | 0.7845 | Yes | ||
| 7 | SPN | 3520338 3870671 | 1940 | 0.223 | 0.7613 | No | ||
| 8 | DEFB127 | 520564 | 2633 | 0.139 | 0.7424 | No | ||
| 9 | PGLYRP4 | 3780411 | 2749 | 0.128 | 0.7530 | No | ||
| 10 | STAB2 | 4810452 | 2907 | 0.114 | 0.7595 | No | ||
| 11 | STAB1 | 5390707 | 3867 | 0.062 | 0.7160 | No | ||
| 12 | DMBT1 | 7050270 | 5222 | 0.030 | 0.6471 | No | ||
| 13 | LALBA | 6940685 | 7169 | 0.012 | 0.5440 | No | ||
| 14 | WFDC12 | 6980647 | 7449 | 0.011 | 0.5304 | No | ||
| 15 | DEFB103A | 50014 | 8187 | 0.008 | 0.4918 | No | ||
| 16 | SPACA3 | 1850161 | 9333 | 0.004 | 0.4307 | No | ||
| 17 | CHIT1 | 7050347 | 9996 | 0.002 | 0.3954 | No | ||
| 18 | PGLYRP3 | 6350403 | 10163 | 0.002 | 0.3867 | No | ||
| 19 | TLR6 | 510102 3390148 | 11608 | -0.003 | 0.3093 | No | ||
| 20 | NLRC4 | 5570332 | 11714 | -0.003 | 0.3041 | No | ||
| 21 | TLR3 | 6760451 | 12565 | -0.006 | 0.2592 | No | ||
| 22 | CD24 | 1780091 | 13227 | -0.010 | 0.2249 | No | ||
| 23 | NOD2 | 2510050 | 15186 | -0.045 | 0.1254 | No | ||
| 24 | BCL10 | 2360397 | 15829 | -0.083 | 0.1019 | No | ||
| 25 | IL12A | 7100551 | 16072 | -0.102 | 0.1022 | No | ||
| 26 | IL10 | 2340685 2640541 2850403 6590286 | 17148 | -0.263 | 0.0790 | No |

