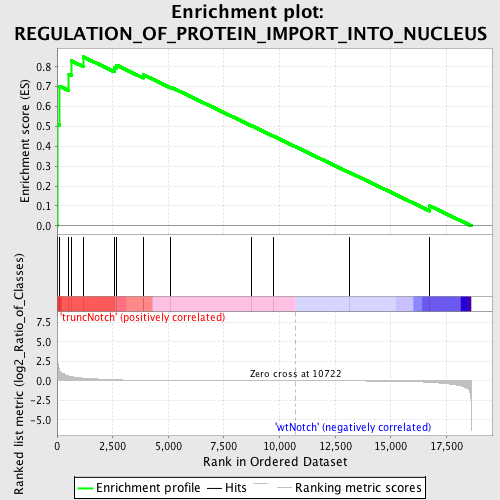
Profile of the Running ES Score & Positions of GeneSet Members on the Rank Ordered List
| Dataset | Set_03_truncNotch_versus_wtNotch.phenotype_truncNotch_versus_wtNotch.cls #truncNotch_versus_wtNotch |
| Phenotype | phenotype_truncNotch_versus_wtNotch.cls#truncNotch_versus_wtNotch |
| Upregulated in class | truncNotch |
| GeneSet | REGULATION_OF_PROTEIN_IMPORT_INTO_NUCLEUS |
| Enrichment Score (ES) | 0.8499577 |
| Normalized Enrichment Score (NES) | 1.4822656 |
| Nominal p-value | 0.023809524 |
| FDR q-value | 0.72782266 |
| FWER p-Value | 1.0 |
| PROBE | DESCRIPTION (from dataset) | GENE SYMBOL | GENE_TITLE | RANK IN GENE LIST | RANK METRIC SCORE | RUNNING ES | CORE ENRICHMENT | |
|---|---|---|---|---|---|---|---|---|
| 1 | FAF1 | 2450717 2510121 4730156 | 8 | 3.763 | 0.5116 | Yes | ||
| 2 | NFKBIE | 580390 2190086 | 105 | 1.445 | 0.7031 | Yes | ||
| 3 | SMAD3 | 6450671 | 532 | 0.607 | 0.7629 | Yes | ||
| 4 | FLNA | 5390193 | 637 | 0.535 | 0.8300 | Yes | ||
| 5 | NFKBIL1 | 6590398 | 1173 | 0.358 | 0.8500 | Yes | ||
| 6 | TGFB1 | 1940162 | 2566 | 0.146 | 0.7951 | No | ||
| 7 | CDH1 | 1940736 | 2664 | 0.136 | 0.8083 | No | ||
| 8 | MXI1 | 5050064 5130484 | 3870 | 0.061 | 0.7519 | No | ||
| 9 | MDFI | 6200041 | 3888 | 0.061 | 0.7593 | No | ||
| 10 | TNFSF14 | 1450369 5550594 | 5116 | 0.032 | 0.6976 | No | ||
| 11 | NLRP3 | 1980064 4010180 | 8757 | 0.006 | 0.5027 | No | ||
| 12 | NF1 | 6980433 | 9709 | 0.003 | 0.4520 | No | ||
| 13 | TRIP6 | 6520609 | 13152 | -0.009 | 0.2682 | No | ||
| 14 | BCL3 | 3990440 | 16752 | -0.187 | 0.1002 | No |

