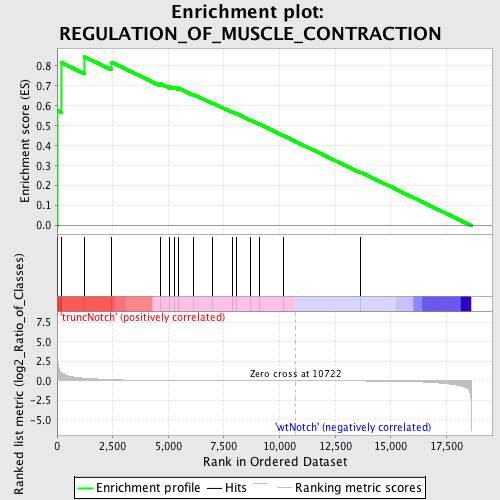
Profile of the Running ES Score & Positions of GeneSet Members on the Rank Ordered List
| Dataset | Set_03_truncNotch_versus_wtNotch.phenotype_truncNotch_versus_wtNotch.cls #truncNotch_versus_wtNotch |
| Phenotype | phenotype_truncNotch_versus_wtNotch.cls#truncNotch_versus_wtNotch |
| Upregulated in class | truncNotch |
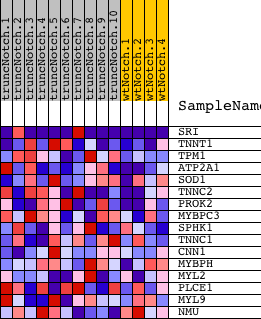
| GeneSet | REGULATION_OF_MUSCLE_CONTRACTION |
| Enrichment Score (ES) | 0.845822 |
| Normalized Enrichment Score (NES) | 1.5440339 |
| Nominal p-value | 0.01119403 |
| FDR q-value | 0.80521125 |
| FWER p-Value | 0.994 |
| PROBE | DESCRIPTION (from dataset) | GENE SYMBOL | GENE_TITLE | RANK IN GENE LIST | RANK METRIC SCORE | RUNNING ES | CORE ENRICHMENT | |
|---|---|---|---|---|---|---|---|---|
| 1 | SRI | 3390446 4850064 | 34 | 2.378 | 0.5752 | Yes | ||
| 2 | TNNT1 | 3360671 | 211 | 1.031 | 0.8159 | Yes | ||
| 3 | TPM1 | 130673 | 1229 | 0.349 | 0.8458 | Yes | ||
| 4 | ATP2A1 | 110309 | 2443 | 0.159 | 0.8191 | No | ||
| 5 | SOD1 | 5890070 | 4644 | 0.040 | 0.7106 | No | ||
| 6 | TNNC2 | 3840079 | 5039 | 0.033 | 0.6974 | No | ||
| 7 | PROK2 | 540538 | 5258 | 0.030 | 0.6929 | No | ||
| 8 | MYBPC3 | 650390 | 5436 | 0.027 | 0.6900 | No | ||
| 9 | SPHK1 | 2470113 4230398 6220397 | 6130 | 0.020 | 0.6575 | No | ||
| 10 | TNNC1 | 1990575 | 7001 | 0.013 | 0.6139 | No | ||
| 11 | CNN1 | 510707 | 7892 | 0.009 | 0.5682 | No | ||
| 12 | MYBPH | 2190711 | 8041 | 0.008 | 0.5623 | No | ||
| 13 | MYL2 | 70471 | 8696 | 0.006 | 0.5285 | No | ||
| 14 | PLCE1 | 4780685 | 9075 | 0.005 | 0.5094 | No | ||
| 15 | MYL9 | 4210750 7050138 | 10175 | 0.002 | 0.4506 | No | ||
| 16 | NMU | 6400025 | 13633 | -0.013 | 0.2679 | No |