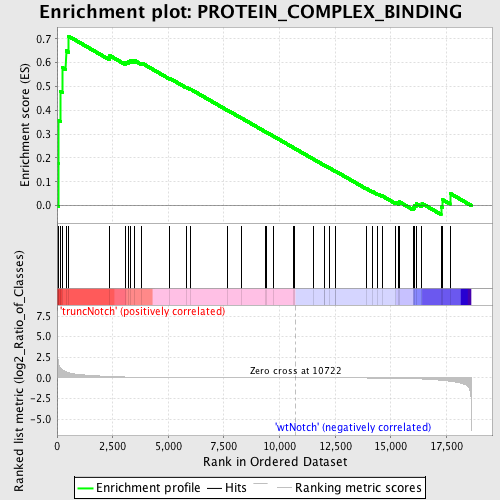
Profile of the Running ES Score & Positions of GeneSet Members on the Rank Ordered List
| Dataset | Set_03_truncNotch_versus_wtNotch.phenotype_truncNotch_versus_wtNotch.cls #truncNotch_versus_wtNotch |
| Phenotype | phenotype_truncNotch_versus_wtNotch.cls#truncNotch_versus_wtNotch |
| Upregulated in class | truncNotch |
| GeneSet | PROTEIN_COMPLEX_BINDING |
| Enrichment Score (ES) | 0.71116364 |
| Normalized Enrichment Score (NES) | 1.518927 |
| Nominal p-value | 0.010869565 |
| FDR q-value | 0.7021271 |
| FWER p-Value | 1.0 |
| PROBE | DESCRIPTION (from dataset) | GENE SYMBOL | GENE_TITLE | RANK IN GENE LIST | RANK METRIC SCORE | RUNNING ES | CORE ENRICHMENT | |
|---|---|---|---|---|---|---|---|---|
| 1 | ACTN2 | 4200435 | 63 | 1.683 | 0.1786 | Yes | ||
| 2 | MSH6 | 4480064 6520093 | 71 | 1.653 | 0.3570 | Yes | ||
| 3 | ERCC8 | 1240300 6450372 6590180 | 145 | 1.176 | 0.4803 | Yes | ||
| 4 | TGFBI | 2060446 6900112 | 250 | 0.957 | 0.5782 | Yes | ||
| 5 | ACTN4 | 3840301 4590390 7050132 | 399 | 0.733 | 0.6495 | Yes | ||
| 6 | MUTYH | 1780441 5700121 | 510 | 0.625 | 0.7112 | Yes | ||
| 7 | COL16A1 | 1780520 | 2369 | 0.168 | 0.6293 | No | ||
| 8 | MSH2 | 6180273 | 3077 | 0.102 | 0.6022 | No | ||
| 9 | ICAM2 | 6400113 | 3205 | 0.094 | 0.6056 | No | ||
| 10 | ICAM4 | 6770053 | 3301 | 0.088 | 0.6099 | No | ||
| 11 | ACTN3 | 3140541 6480598 | 3479 | 0.078 | 0.6088 | No | ||
| 12 | ECM2 | 1470561 | 3814 | 0.064 | 0.5977 | No | ||
| 13 | TREX1 | 3450040 7100692 | 5057 | 0.033 | 0.5344 | No | ||
| 14 | DST | 430026 1090035 2340577 3170068 3870112 4780519 6400167 6450358 7040347 | 5814 | 0.023 | 0.4962 | No | ||
| 15 | FBLN5 | 6550010 | 6017 | 0.021 | 0.4875 | No | ||
| 16 | EDIL3 | 1240039 | 7648 | 0.010 | 0.4009 | No | ||
| 17 | SYK | 6940133 | 8308 | 0.007 | 0.3662 | No | ||
| 18 | EGFL6 | 3940181 | 9353 | 0.004 | 0.3104 | No | ||
| 19 | PIK3R1 | 4730671 | 9416 | 0.004 | 0.3074 | No | ||
| 20 | DMP1 | 4760398 | 9724 | 0.003 | 0.2912 | No | ||
| 21 | ADAMTS5 | 5890592 | 10645 | 0.000 | 0.2417 | No | ||
| 22 | CAV3 | 1770519 | 10672 | 0.000 | 0.2403 | No | ||
| 23 | IRS1 | 1190204 | 11518 | -0.002 | 0.1951 | No | ||
| 24 | ADAM2 | 670121 | 12000 | -0.004 | 0.1696 | No | ||
| 25 | COL4A3 | 5910075 | 12009 | -0.004 | 0.1696 | No | ||
| 26 | VWF | 4670519 | 12248 | -0.005 | 0.1573 | No | ||
| 27 | ADAM23 | 460091 2450156 | 12530 | -0.006 | 0.1428 | No | ||
| 28 | ANGPTL3 | 6180497 | 12533 | -0.006 | 0.1434 | No | ||
| 29 | ADAMTS8 | 3990497 | 13904 | -0.015 | 0.0713 | No | ||
| 30 | TNXB | 630592 3830020 5360497 7000673 | 14176 | -0.019 | 0.0587 | No | ||
| 31 | INSL3 | 4150092 | 14420 | -0.023 | 0.0481 | No | ||
| 32 | PEX6 | 2100253 6660162 | 14609 | -0.026 | 0.0408 | No | ||
| 33 | THY1 | 5910162 | 15212 | -0.046 | 0.0133 | No | ||
| 34 | ADAM11 | 1050008 3130494 | 15357 | -0.052 | 0.0112 | No | ||
| 35 | SHC1 | 2900731 3170504 6520537 | 15376 | -0.053 | 0.0159 | No | ||
| 36 | ADAM9 | 3360411 | 16007 | -0.096 | -0.0075 | No | ||
| 37 | PMS2 | 6760739 | 16075 | -0.102 | -0.0001 | No | ||
| 38 | ERBB2IP | 580253 1090672 | 16136 | -0.108 | 0.0084 | No | ||
| 39 | DOCK2 | 2940040 | 16400 | -0.136 | 0.0089 | No | ||
| 40 | ATR | 6860273 | 17259 | -0.292 | -0.0058 | No | ||
| 41 | MLH1 | 6450168 | 17332 | -0.314 | 0.0243 | No | ||
| 42 | PCNA | 940754 | 17662 | -0.414 | 0.0514 | No |

