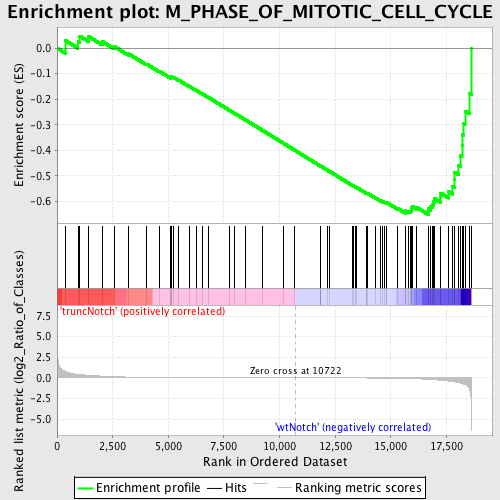
Profile of the Running ES Score & Positions of GeneSet Members on the Rank Ordered List
| Dataset | Set_03_truncNotch_versus_wtNotch.phenotype_truncNotch_versus_wtNotch.cls #truncNotch_versus_wtNotch |
| Phenotype | phenotype_truncNotch_versus_wtNotch.cls#truncNotch_versus_wtNotch |
| Upregulated in class | wtNotch |
| GeneSet | M_PHASE_OF_MITOTIC_CELL_CYCLE |
| Enrichment Score (ES) | -0.6511381 |
| Normalized Enrichment Score (NES) | -1.5950016 |
| Nominal p-value | 0.00486618 |
| FDR q-value | 0.25766614 |
| FWER p-Value | 0.944 |
| PROBE | DESCRIPTION (from dataset) | GENE SYMBOL | GENE_TITLE | RANK IN GENE LIST | RANK METRIC SCORE | RUNNING ES | CORE ENRICHMENT | |
|---|---|---|---|---|---|---|---|---|
| 1 | MAD2L2 | 1240358 | 362 | 0.781 | 0.0305 | No | ||
| 2 | TARDBP | 870390 2350093 | 938 | 0.419 | 0.0263 | No | ||
| 3 | CHMP1A | 5550441 | 1022 | 0.394 | 0.0470 | No | ||
| 4 | CDC25B | 6940102 | 1428 | 0.308 | 0.0449 | No | ||
| 5 | CHFR | 3390050 6450300 6450736 | 2032 | 0.211 | 0.0259 | No | ||
| 6 | TGFB1 | 1940162 | 2566 | 0.146 | 0.0065 | No | ||
| 7 | NUMA1 | 6520576 | 3219 | 0.092 | -0.0228 | No | ||
| 8 | DCTN2 | 540471 3780717 | 4018 | 0.057 | -0.0621 | No | ||
| 9 | RCC1 | 2480358 | 4585 | 0.042 | -0.0900 | No | ||
| 10 | ANAPC11 | 1780601 | 5099 | 0.032 | -0.1156 | No | ||
| 11 | CDKN2B | 6020040 | 5117 | 0.032 | -0.1145 | No | ||
| 12 | ANLN | 1780113 2470537 6840047 | 5124 | 0.032 | -0.1128 | No | ||
| 13 | UBE2C | 6130017 | 5158 | 0.031 | -0.1126 | No | ||
| 14 | CDCA5 | 5670131 | 5231 | 0.030 | -0.1145 | No | ||
| 15 | PLK1 | 1780369 2640121 | 5459 | 0.027 | -0.1250 | No | ||
| 16 | CENPE | 2850022 | 5930 | 0.021 | -0.1490 | No | ||
| 17 | NEK6 | 3360687 | 6249 | 0.019 | -0.1650 | No | ||
| 18 | PRMT5 | 2760180 4590072 | 6528 | 0.016 | -0.1789 | No | ||
| 19 | CLIP1 | 2850162 6770397 | 6821 | 0.014 | -0.1938 | No | ||
| 20 | NEK2 | 2120520 | 7736 | 0.010 | -0.2424 | No | ||
| 21 | CETN1 | 6020056 | 7972 | 0.009 | -0.2546 | No | ||
| 22 | TTN | 2320161 4670056 6550026 | 8482 | 0.007 | -0.2816 | No | ||
| 23 | KIF11 | 5390139 | 9250 | 0.004 | -0.3227 | No | ||
| 24 | BUB1 | 5390270 | 10161 | 0.002 | -0.3716 | No | ||
| 25 | EREG | 50519 4920129 | 10683 | 0.000 | -0.3997 | No | ||
| 26 | RAN | 2260446 4590647 | 11821 | -0.003 | -0.4608 | No | ||
| 27 | ANAPC10 | 870086 1170037 2260129 | 11836 | -0.003 | -0.4614 | No | ||
| 28 | PAM | 5290528 | 11858 | -0.003 | -0.4623 | No | ||
| 29 | TTK | 3800129 | 12142 | -0.004 | -0.4773 | No | ||
| 30 | KIF2C | 6940082 | 12263 | -0.005 | -0.4834 | No | ||
| 31 | EPGN | 6980450 | 13267 | -0.010 | -0.5369 | No | ||
| 32 | NBN | 730538 2470619 4780594 | 13305 | -0.010 | -0.5382 | No | ||
| 33 | KIF15 | 610731 4070731 6520014 | 13401 | -0.011 | -0.5426 | No | ||
| 34 | CDC23 | 3190593 | 13446 | -0.011 | -0.5443 | No | ||
| 35 | ATM | 3610110 4050524 | 13898 | -0.015 | -0.5676 | No | ||
| 36 | DCTN3 | 6840131 | 13908 | -0.015 | -0.5671 | No | ||
| 37 | PML | 50093 2190435 2450402 3840082 | 13951 | -0.016 | -0.5684 | No | ||
| 38 | CDC25C | 2570673 4760161 6520707 | 14329 | -0.021 | -0.5873 | No | ||
| 39 | NPM2 | 6040139 | 14553 | -0.025 | -0.5977 | No | ||
| 40 | SMC3 | 870546 1400411 5700039 6450577 | 14645 | -0.027 | -0.6009 | No | ||
| 41 | TGFA | 1570332 | 14731 | -0.029 | -0.6036 | No | ||
| 42 | PIN1 | 2970408 | 14788 | -0.031 | -0.6047 | No | ||
| 43 | DDX11 | 6590671 | 14823 | -0.032 | -0.6045 | No | ||
| 44 | RAD17 | 5220739 | 15306 | -0.049 | -0.6273 | No | ||
| 45 | NOLC1 | 2350195 | 15646 | -0.070 | -0.6411 | Yes | ||
| 46 | PPP5C | 3130047 | 15659 | -0.071 | -0.6372 | Yes | ||
| 47 | KIF22 | 1190368 | 15776 | -0.079 | -0.6384 | Yes | ||
| 48 | SSSCA1 | 1240402 780309 | 15875 | -0.086 | -0.6382 | Yes | ||
| 49 | EGF | 5220154 | 15914 | -0.089 | -0.6345 | Yes | ||
| 50 | SMC4 | 5910240 | 15937 | -0.091 | -0.6299 | Yes | ||
| 51 | CIT | 2370601 | 15947 | -0.091 | -0.6245 | Yes | ||
| 52 | SUGT1 | 1690670 | 15953 | -0.092 | -0.6189 | Yes | ||
| 53 | CCNA2 | 5290075 | 16158 | -0.110 | -0.6229 | Yes | ||
| 54 | KNTC1 | 430079 | 16683 | -0.178 | -0.6398 | Yes | ||
| 55 | CD28 | 1400739 4210093 | 16693 | -0.179 | -0.6288 | Yes | ||
| 56 | CDC16 | 1940706 | 16789 | -0.194 | -0.6215 | Yes | ||
| 57 | BIRC5 | 110408 580014 1770632 | 16855 | -0.207 | -0.6117 | Yes | ||
| 58 | DLG7 | 3120041 | 16935 | -0.220 | -0.6019 | Yes | ||
| 59 | AURKA | 780537 | 16964 | -0.225 | -0.5890 | Yes | ||
| 60 | NDC80 | 4120465 | 17235 | -0.283 | -0.5854 | Yes | ||
| 61 | ZWINT | 6940670 | 17240 | -0.284 | -0.5674 | Yes | ||
| 62 | PCBP4 | 6350722 | 17598 | -0.387 | -0.5619 | Yes | ||
| 63 | MPHOSPH6 | 5570164 | 17770 | -0.450 | -0.5423 | Yes | ||
| 64 | ANAPC5 | 730164 7100685 | 17854 | -0.485 | -0.5157 | Yes | ||
| 65 | ANAPC4 | 4540338 | 17861 | -0.487 | -0.4849 | Yes | ||
| 66 | MAD2L1 | 4480725 | 18047 | -0.583 | -0.4576 | Yes | ||
| 67 | NCAPH | 6220435 | 18140 | -0.637 | -0.4218 | Yes | ||
| 68 | AKAP8 | 4210026 | 18200 | -0.672 | -0.3819 | Yes | ||
| 69 | BUB1B | 1450288 | 18215 | -0.685 | -0.3389 | Yes | ||
| 70 | TPX2 | 6420324 | 18266 | -0.736 | -0.2945 | Yes | ||
| 71 | ZW10 | 2900735 3520687 | 18335 | -0.804 | -0.2467 | Yes | ||
| 72 | SMC1A | 3060600 5700148 5890113 6370154 | 18529 | -1.261 | -0.1764 | Yes | ||
| 73 | NUSAP1 | 940048 3120435 | 18611 | -2.829 | 0.0003 | Yes |

