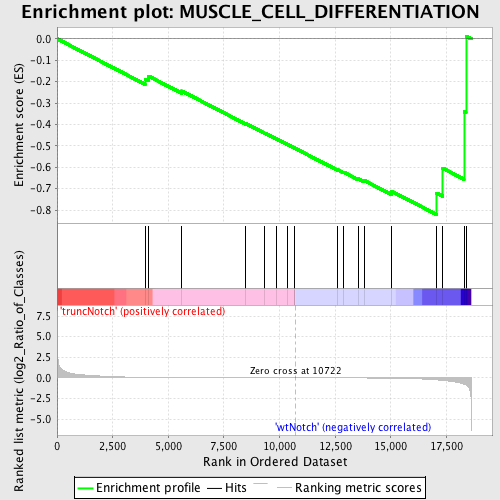
Profile of the Running ES Score & Positions of GeneSet Members on the Rank Ordered List
| Dataset | Set_03_truncNotch_versus_wtNotch.phenotype_truncNotch_versus_wtNotch.cls #truncNotch_versus_wtNotch |
| Phenotype | phenotype_truncNotch_versus_wtNotch.cls#truncNotch_versus_wtNotch |
| Upregulated in class | wtNotch |
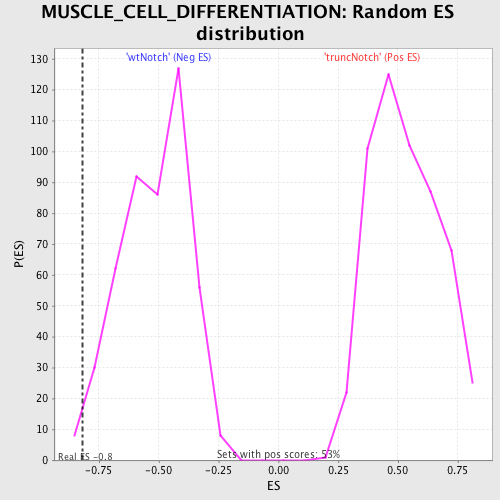
| GeneSet | MUSCLE_CELL_DIFFERENTIATION |
| Enrichment Score (ES) | -0.8207641 |
| Normalized Enrichment Score (NES) | -1.5830786 |
| Nominal p-value | 0.012793177 |
| FDR q-value | 0.2891533 |
| FWER p-Value | 0.961 |
| PROBE | DESCRIPTION (from dataset) | GENE SYMBOL | GENE_TITLE | RANK IN GENE LIST | RANK METRIC SCORE | RUNNING ES | CORE ENRICHMENT | |
|---|---|---|---|---|---|---|---|---|
| 1 | TBX3 | 2570672 | 3955 | 0.059 | -0.1883 | No | ||
| 2 | MAPK12 | 450022 1340717 7050484 | 4113 | 0.054 | -0.1745 | No | ||
| 3 | KCNH1 | 4070619 6660181 | 5596 | 0.025 | -0.2437 | No | ||
| 4 | TTN | 2320161 4670056 6550026 | 8482 | 0.007 | -0.3961 | No | ||
| 5 | ACTA1 | 840538 | 9335 | 0.004 | -0.4403 | No | ||
| 6 | GLMN | 5290563 5890239 | 9841 | 0.002 | -0.4664 | No | ||
| 7 | BOC | 5270348 | 10357 | 0.001 | -0.4937 | No | ||
| 8 | MYH11 | 7100273 | 10648 | 0.000 | -0.5092 | No | ||
| 9 | EREG | 50519 4920129 | 10683 | 0.000 | -0.5109 | No | ||
| 10 | BMP4 | 380113 | 12597 | -0.006 | -0.6112 | No | ||
| 11 | IGFBP3 | 2370500 | 12867 | -0.008 | -0.6225 | No | ||
| 12 | IFRD1 | 4590215 | 13544 | -0.012 | -0.6539 | No | ||
| 13 | MYOZ1 | 2760670 | 13807 | -0.014 | -0.6621 | No | ||
| 14 | ADAM12 | 3390132 4070347 | 15020 | -0.038 | -0.7115 | No | ||
| 15 | NOTCH1 | 3390114 | 17053 | -0.243 | -0.7204 | Yes | ||
| 16 | MYEF2 | 6860484 | 17338 | -0.316 | -0.6050 | Yes | ||
| 17 | CACNA1H | 1230279 | 18291 | -0.765 | -0.3400 | Yes | ||
| 18 | MBNL1 | 2640762 7100048 | 18381 | -0.865 | 0.0126 | Yes |