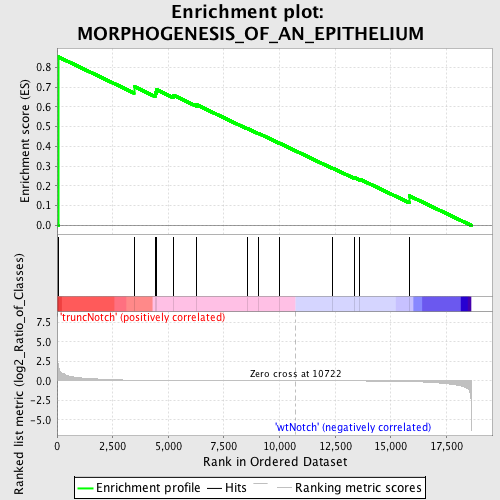
Profile of the Running ES Score & Positions of GeneSet Members on the Rank Ordered List
| Dataset | Set_03_truncNotch_versus_wtNotch.phenotype_truncNotch_versus_wtNotch.cls #truncNotch_versus_wtNotch |
| Phenotype | phenotype_truncNotch_versus_wtNotch.cls#truncNotch_versus_wtNotch |
| Upregulated in class | truncNotch |
| GeneSet | MORPHOGENESIS_OF_AN_EPITHELIUM |
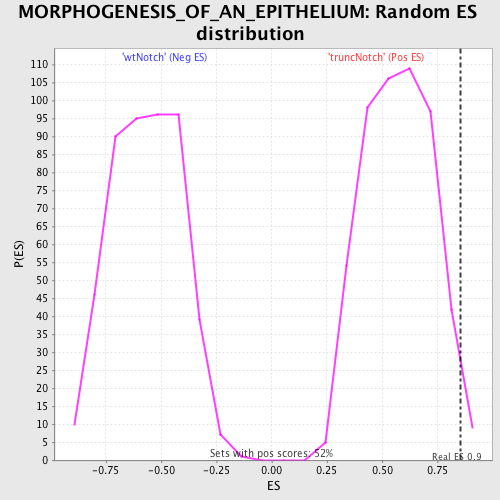
| Enrichment Score (ES) | 0.852739 |
| Normalized Enrichment Score (NES) | 1.4881396 |
| Nominal p-value | 0.017307693 |
| FDR q-value | 0.7228303 |
| FWER p-Value | 1.0 |
| PROBE | DESCRIPTION (from dataset) | GENE SYMBOL | GENE_TITLE | RANK IN GENE LIST | RANK METRIC SCORE | RUNNING ES | CORE ENRICHMENT | |
|---|---|---|---|---|---|---|---|---|
| 1 | VANGL2 | 70097 870075 | 50 | 2.031 | 0.8527 | Yes | ||
| 2 | CELSR1 | 6510348 | 3458 | 0.079 | 0.7028 | No | ||
| 3 | GLI2 | 3060632 | 4406 | 0.046 | 0.6712 | No | ||
| 4 | LMO4 | 3800746 | 4468 | 0.045 | 0.6867 | No | ||
| 5 | DMBT1 | 7050270 | 5222 | 0.030 | 0.6590 | No | ||
| 6 | ELF3 | 770551 6180019 | 6274 | 0.018 | 0.6102 | No | ||
| 7 | TIMELESS | 3710315 | 8546 | 0.006 | 0.4909 | No | ||
| 8 | UPK3A | 1410717 | 9041 | 0.005 | 0.4663 | No | ||
| 9 | EHF | 4560088 | 9976 | 0.002 | 0.4170 | No | ||
| 10 | UPK2 | 60176 | 12380 | -0.005 | 0.2901 | No | ||
| 11 | UPK1B | 3290736 | 13367 | -0.011 | 0.2416 | No | ||
| 12 | SPINK5 | 5900010 | 13600 | -0.012 | 0.2344 | No | ||
| 13 | BCL10 | 2360397 | 15829 | -0.083 | 0.1498 | No |