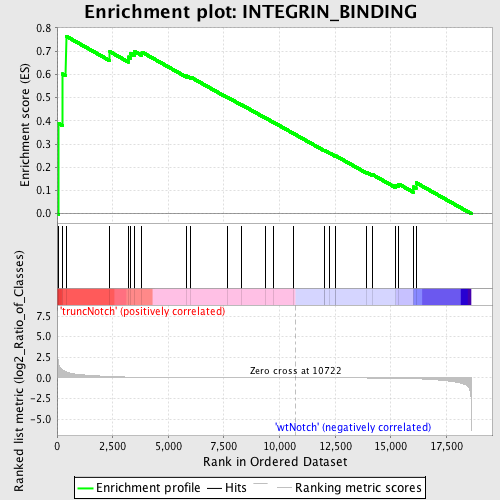
Profile of the Running ES Score & Positions of GeneSet Members on the Rank Ordered List
| Dataset | Set_03_truncNotch_versus_wtNotch.phenotype_truncNotch_versus_wtNotch.cls #truncNotch_versus_wtNotch |
| Phenotype | phenotype_truncNotch_versus_wtNotch.cls#truncNotch_versus_wtNotch |
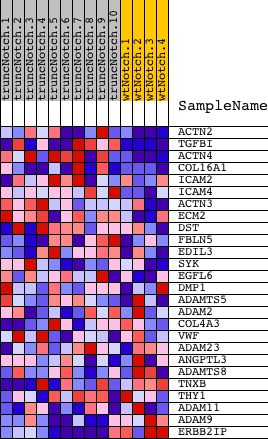
| Upregulated in class | truncNotch |
| GeneSet | INTEGRIN_BINDING |
| Enrichment Score (ES) | 0.76451665 |
| Normalized Enrichment Score (NES) | 1.5009763 |
| Nominal p-value | 0.032967035 |
| FDR q-value | 0.650931 |
| FWER p-Value | 1.0 |
| PROBE | DESCRIPTION (from dataset) | GENE SYMBOL | GENE_TITLE | RANK IN GENE LIST | RANK METRIC SCORE | RUNNING ES | CORE ENRICHMENT | |
|---|---|---|---|---|---|---|---|---|
| 1 | ACTN2 | 4200435 | 63 | 1.683 | 0.3887 | Yes | ||
| 2 | TGFBI | 2060446 6900112 | 250 | 0.957 | 0.6017 | Yes | ||
| 3 | ACTN4 | 3840301 4590390 7050132 | 399 | 0.733 | 0.7645 | Yes | ||
| 4 | COL16A1 | 1780520 | 2369 | 0.168 | 0.6976 | No | ||
| 5 | ICAM2 | 6400113 | 3205 | 0.094 | 0.6747 | No | ||
| 6 | ICAM4 | 6770053 | 3301 | 0.088 | 0.6900 | No | ||
| 7 | ACTN3 | 3140541 6480598 | 3479 | 0.078 | 0.6987 | No | ||
| 8 | ECM2 | 1470561 | 3814 | 0.064 | 0.6955 | No | ||
| 9 | DST | 430026 1090035 2340577 3170068 3870112 4780519 6400167 6450358 7040347 | 5814 | 0.023 | 0.5933 | No | ||
| 10 | FBLN5 | 6550010 | 6017 | 0.021 | 0.5872 | No | ||
| 11 | EDIL3 | 1240039 | 7648 | 0.010 | 0.5019 | No | ||
| 12 | SYK | 6940133 | 8308 | 0.007 | 0.4681 | No | ||
| 13 | EGFL6 | 3940181 | 9353 | 0.004 | 0.4129 | No | ||
| 14 | DMP1 | 4760398 | 9724 | 0.003 | 0.3936 | No | ||
| 15 | ADAMTS5 | 5890592 | 10645 | 0.000 | 0.3442 | No | ||
| 16 | ADAM2 | 670121 | 12000 | -0.004 | 0.2723 | No | ||
| 17 | COL4A3 | 5910075 | 12009 | -0.004 | 0.2727 | No | ||
| 18 | VWF | 4670519 | 12248 | -0.005 | 0.2611 | No | ||
| 19 | ADAM23 | 460091 2450156 | 12530 | -0.006 | 0.2473 | No | ||
| 20 | ANGPTL3 | 6180497 | 12533 | -0.006 | 0.2486 | No | ||
| 21 | ADAMTS8 | 3990497 | 13904 | -0.015 | 0.1785 | No | ||
| 22 | TNXB | 630592 3830020 5360497 7000673 | 14176 | -0.019 | 0.1683 | No | ||
| 23 | THY1 | 5910162 | 15212 | -0.046 | 0.1233 | No | ||
| 24 | ADAM11 | 1050008 3130494 | 15357 | -0.052 | 0.1276 | No | ||
| 25 | ADAM9 | 3360411 | 16007 | -0.096 | 0.1152 | No | ||
| 26 | ERBB2IP | 580253 1090672 | 16136 | -0.108 | 0.1334 | No |