Profile of the Running ES Score & Positions of GeneSet Members on the Rank Ordered List
| Dataset | Set_03_truncNotch_versus_wtNotch.phenotype_truncNotch_versus_wtNotch.cls #truncNotch_versus_wtNotch |
| Phenotype | phenotype_truncNotch_versus_wtNotch.cls#truncNotch_versus_wtNotch |
| Upregulated in class | truncNotch |
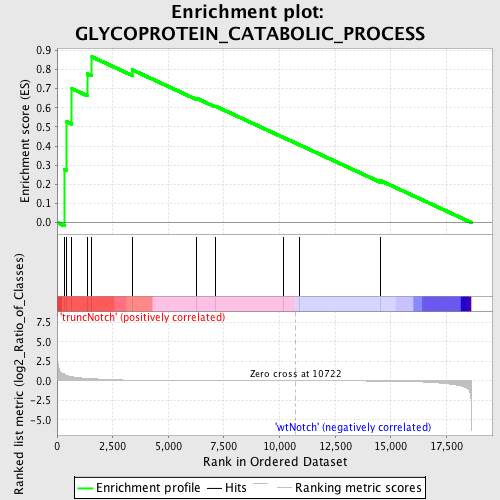
| GeneSet | GLYCOPROTEIN_CATABOLIC_PROCESS |
| Enrichment Score (ES) | 0.86602604 |
| Normalized Enrichment Score (NES) | 1.4681339 |
| Nominal p-value | 0.025096525 |
| FDR q-value | 0.693106 |
| FWER p-Value | 1.0 |
| PROBE | DESCRIPTION (from dataset) | GENE SYMBOL | GENE_TITLE | RANK IN GENE LIST | RANK METRIC SCORE | RUNNING ES | CORE ENRICHMENT | |
|---|---|---|---|---|---|---|---|---|
| 1 | PSEN1 | 130403 2030647 6100603 | 332 | 0.837 | 0.2783 | Yes | ||
| 2 | NCSTN | 940601 6400594 | 409 | 0.719 | 0.5283 | Yes | ||
| 3 | PSEN2 | 130382 | 663 | 0.524 | 0.6999 | Yes | ||
| 4 | CLN3 | 780368 | 1361 | 0.324 | 0.7770 | Yes | ||
| 5 | ABCG1 | 60692 | 1566 | 0.283 | 0.8660 | Yes | ||
| 6 | MAN2B1 | 4210446 | 3374 | 0.083 | 0.7984 | No | ||
| 7 | APH1A | 4060273 4670465 6450711 | 6276 | 0.018 | 0.6490 | No | ||
| 8 | AGA | 6350292 | 7107 | 0.013 | 0.6088 | No | ||
| 9 | MGEA5 | 6100014 | 10159 | 0.002 | 0.4454 | No | ||
| 10 | ADAMTS9 | 2760079 | 10905 | -0.001 | 0.4055 | No | ||
| 11 | NGLY1 | 1570037 | 14544 | -0.025 | 0.2189 | No |

