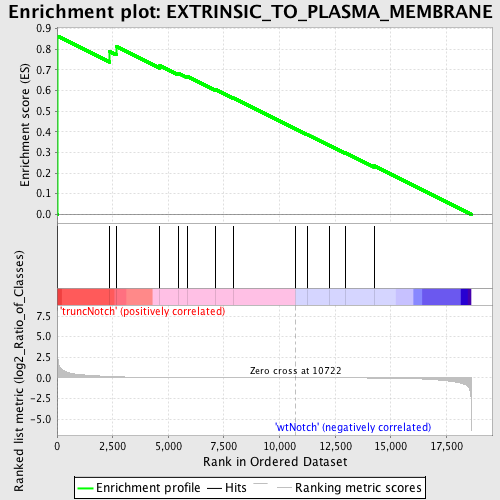
Profile of the Running ES Score & Positions of GeneSet Members on the Rank Ordered List
| Dataset | Set_03_truncNotch_versus_wtNotch.phenotype_truncNotch_versus_wtNotch.cls #truncNotch_versus_wtNotch |
| Phenotype | phenotype_truncNotch_versus_wtNotch.cls#truncNotch_versus_wtNotch |
| Upregulated in class | truncNotch |
| GeneSet | EXTRINSIC_TO_PLASMA_MEMBRANE |
| Enrichment Score (ES) | 0.86377877 |
| Normalized Enrichment Score (NES) | 1.5103481 |
| Nominal p-value | 0.020220589 |
| FDR q-value | 0.72697735 |
| FWER p-Value | 1.0 |
| PROBE | DESCRIPTION (from dataset) | GENE SYMBOL | GENE_TITLE | RANK IN GENE LIST | RANK METRIC SCORE | RUNNING ES | CORE ENRICHMENT | |
|---|---|---|---|---|---|---|---|---|
| 1 | GNAS | 630441 1850373 4050152 | 19 | 2.879 | 0.8638 | Yes | ||
| 2 | RGS19 | 7050427 | 2362 | 0.168 | 0.7885 | No | ||
| 3 | SYTL1 | 510487 | 2663 | 0.136 | 0.8131 | No | ||
| 4 | SYTL2 | 580097 5390576 6770603 | 4615 | 0.041 | 0.7205 | No | ||
| 5 | SCUBE1 | 5130551 | 5445 | 0.027 | 0.6841 | No | ||
| 6 | SYTL4 | 3060066 | 5879 | 0.022 | 0.6675 | No | ||
| 7 | TGM3 | 840576 | 7101 | 0.013 | 0.6056 | No | ||
| 8 | EEA1 | 3940044 4010301 | 7926 | 0.009 | 0.5640 | No | ||
| 9 | APC2 | 3170215 | 10710 | 0.000 | 0.4144 | No | ||
| 10 | ARRB1 | 2650670 2690195 4920592 6660121 | 11269 | -0.002 | 0.3849 | No | ||
| 11 | GNAI1 | 4560390 | 12252 | -0.005 | 0.3336 | No | ||
| 12 | GNA14 | 3390017 | 12941 | -0.008 | 0.2990 | No | ||
| 13 | TDGF1 | 1690338 6760070 | 14253 | -0.020 | 0.2345 | No |

