Profile of the Running ES Score & Positions of GeneSet Members on the Rank Ordered List
| Dataset | Set_03_truncNotch_versus_wtNotch.phenotype_truncNotch_versus_wtNotch.cls #truncNotch_versus_wtNotch |
| Phenotype | phenotype_truncNotch_versus_wtNotch.cls#truncNotch_versus_wtNotch |
| Upregulated in class | wtNotch |
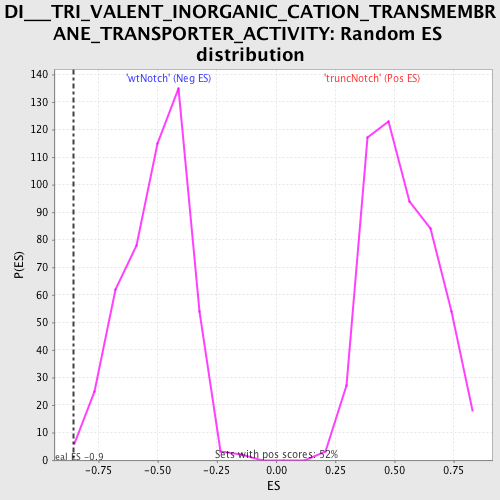
| GeneSet | DI___TRI_VALENT_INORGANIC_CATION_TRANSMEMBRANE_TRANSPORTER_ACTIVITY |
| Enrichment Score (ES) | -0.85721934 |
| Normalized Enrichment Score (NES) | -1.6922126 |
| Nominal p-value | 0.00625 |
| FDR q-value | 0.12605841 |
| FWER p-Value | 0.346 |
| PROBE | DESCRIPTION (from dataset) | GENE SYMBOL | GENE_TITLE | RANK IN GENE LIST | RANK METRIC SCORE | RUNNING ES | CORE ENRICHMENT | |
|---|---|---|---|---|---|---|---|---|
| 1 | SLC11A2 | 3140603 | 1191 | 0.356 | -0.0242 | No | ||
| 2 | FXN | 4070500 | 1649 | 0.268 | -0.0187 | No | ||
| 3 | ATP2A1 | 110309 | 2443 | 0.159 | -0.0436 | No | ||
| 4 | ITPR3 | 4010632 | 3022 | 0.105 | -0.0629 | No | ||
| 5 | SLC8A1 | 3440717 | 5553 | 0.026 | -0.1961 | No | ||
| 6 | SLC40A1 | 2370286 | 6149 | 0.019 | -0.2259 | No | ||
| 7 | CLDN16 | 1850286 | 7472 | 0.011 | -0.2958 | No | ||
| 8 | ATP2B3 | 2260022 3780059 | 9379 | 0.004 | -0.3978 | No | ||
| 9 | CCS | 3450524 | 9849 | 0.002 | -0.4228 | No | ||
| 10 | SLC30A4 | 1850372 | 9891 | 0.002 | -0.4247 | No | ||
| 11 | SLC30A3 | 1850451 | 10057 | 0.002 | -0.4334 | No | ||
| 12 | SLC39A2 | 1410338 | 13262 | -0.010 | -0.6045 | No | ||
| 13 | SLC31A2 | 1450577 | 14610 | -0.026 | -0.6740 | No | ||
| 14 | ATP2C1 | 2630446 6520253 | 15233 | -0.047 | -0.7022 | No | ||
| 15 | ITPR2 | 5360128 | 15705 | -0.074 | -0.7193 | No | ||
| 16 | SLC30A5 | 2630288 2970403 | 18271 | -0.744 | -0.7739 | Yes | ||
| 17 | ITPR1 | 3450519 | 18349 | -0.823 | -0.6858 | Yes | ||
| 18 | SLC31A1 | 4590161 6940154 | 18492 | -1.090 | -0.5713 | Yes | ||
| 19 | ATP2A2 | 1090075 3990279 | 18554 | -1.475 | -0.4092 | Yes | ||
| 20 | ATP2A3 | 130440 2190451 | 18613 | -3.680 | 0.0002 | Yes |