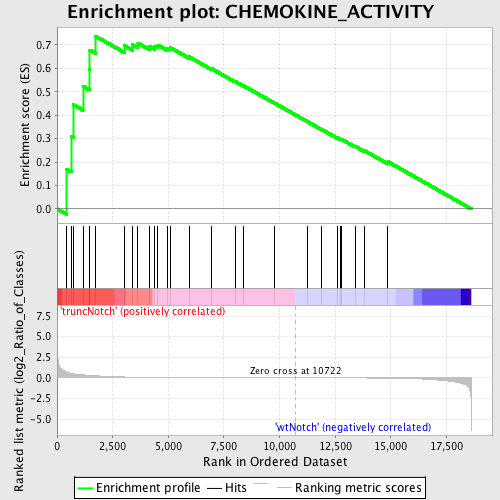
Profile of the Running ES Score & Positions of GeneSet Members on the Rank Ordered List
| Dataset | Set_03_truncNotch_versus_wtNotch.phenotype_truncNotch_versus_wtNotch.cls #truncNotch_versus_wtNotch |
| Phenotype | phenotype_truncNotch_versus_wtNotch.cls#truncNotch_versus_wtNotch |
| Upregulated in class | truncNotch |
| GeneSet | CHEMOKINE_ACTIVITY |
| Enrichment Score (ES) | 0.73758 |
| Normalized Enrichment Score (NES) | 1.4708233 |
| Nominal p-value | 0.02636204 |
| FDR q-value | 0.7063239 |
| FWER p-Value | 1.0 |
| PROBE | DESCRIPTION (from dataset) | GENE SYMBOL | GENE_TITLE | RANK IN GENE LIST | RANK METRIC SCORE | RUNNING ES | CORE ENRICHMENT | |
|---|---|---|---|---|---|---|---|---|
| 1 | CCL4 | 50368 430047 | 440 | 0.680 | 0.1686 | Yes | ||
| 2 | CCL8 | 3870010 | 629 | 0.537 | 0.3104 | Yes | ||
| 3 | CXCL16 | 510278 | 736 | 0.495 | 0.4447 | Yes | ||
| 4 | PF4 | 6130332 | 1165 | 0.359 | 0.5232 | Yes | ||
| 5 | CCL7 | 2650519 | 1443 | 0.305 | 0.5946 | Yes | ||
| 6 | CXCL13 | 6290402 | 1472 | 0.300 | 0.6780 | Yes | ||
| 7 | CCL5 | 3710397 | 1721 | 0.258 | 0.7376 | Yes | ||
| 8 | CXCL1 | 2690537 | 3037 | 0.104 | 0.6963 | No | ||
| 9 | CXCL14 | 840114 6450324 | 3395 | 0.082 | 0.7004 | No | ||
| 10 | CCL27 | 2120070 | 3633 | 0.071 | 0.7076 | No | ||
| 11 | CCL19 | 5080487 | 4172 | 0.052 | 0.6933 | No | ||
| 12 | CX3CL1 | 3990707 | 4394 | 0.046 | 0.6945 | No | ||
| 13 | CXCL9 | 1570673 | 4532 | 0.043 | 0.6993 | No | ||
| 14 | CXCL2 | 610398 | 4948 | 0.035 | 0.6868 | No | ||
| 15 | CCL3 | 2810092 | 5094 | 0.032 | 0.6881 | No | ||
| 16 | CCL1 | 4230167 | 5932 | 0.021 | 0.6491 | No | ||
| 17 | CCL11 | 1770347 | 6960 | 0.013 | 0.5977 | No | ||
| 18 | CXCL5 | 6370333 | 7999 | 0.008 | 0.5442 | No | ||
| 19 | CCL28 | 2690593 | 8396 | 0.007 | 0.5249 | No | ||
| 20 | CXCL10 | 2450408 | 9769 | 0.003 | 0.4518 | No | ||
| 21 | CCL22 | 6380086 | 11267 | -0.002 | 0.3717 | No | ||
| 22 | CXCL12 | 580546 4150750 4570068 | 11890 | -0.003 | 0.3393 | No | ||
| 23 | CCL17 | 630121 | 12581 | -0.006 | 0.3039 | No | ||
| 24 | XCL1 | 3800504 | 12744 | -0.007 | 0.2972 | No | ||
| 25 | CCL2 | 4760019 | 12771 | -0.007 | 0.2978 | No | ||
| 26 | CXCL11 | 1090551 | 13390 | -0.011 | 0.2676 | No | ||
| 27 | CCL25 | 450541 540435 | 13809 | -0.014 | 0.2492 | No | ||
| 28 | CCL24 | 670129 | 14872 | -0.033 | 0.2014 | No |

