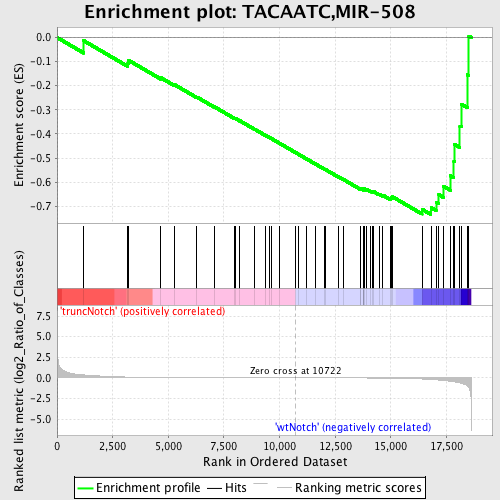
Profile of the Running ES Score & Positions of GeneSet Members on the Rank Ordered List
| Dataset | Set_03_truncNotch_versus_wtNotch.phenotype_truncNotch_versus_wtNotch.cls #truncNotch_versus_wtNotch |
| Phenotype | phenotype_truncNotch_versus_wtNotch.cls#truncNotch_versus_wtNotch |
| Upregulated in class | wtNotch |
| GeneSet | TACAATC,MIR-508 |
| Enrichment Score (ES) | -0.7343861 |
| Normalized Enrichment Score (NES) | -1.6925391 |
| Nominal p-value | 0.0 |
| FDR q-value | 0.021841088 |
| FWER p-Value | 0.126 |
| PROBE | DESCRIPTION (from dataset) | GENE SYMBOL | GENE_TITLE | RANK IN GENE LIST | RANK METRIC SCORE | RUNNING ES | CORE ENRICHMENT | |
|---|---|---|---|---|---|---|---|---|
| 1 | DHDDS | 940148 6650184 | 1197 | 0.355 | -0.0133 | No | ||
| 2 | RAPH1 | 6760411 | 3180 | 0.096 | -0.1062 | No | ||
| 3 | CPNE2 | 60551 | 3216 | 0.093 | -0.0948 | No | ||
| 4 | GLCE | 4850040 | 4663 | 0.040 | -0.1669 | No | ||
| 5 | HTR2C | 380497 | 5287 | 0.029 | -0.1962 | No | ||
| 6 | TNPO1 | 730092 2260735 | 6282 | 0.018 | -0.2471 | No | ||
| 7 | VNN3 | 730053 4610609 | 7064 | 0.013 | -0.2873 | No | ||
| 8 | HBP1 | 2510102 3130010 4210619 | 7990 | 0.009 | -0.3359 | No | ||
| 9 | ARL4C | 1190279 | 8019 | 0.008 | -0.3362 | No | ||
| 10 | HOXA1 | 1190524 5420142 | 8216 | 0.008 | -0.3456 | No | ||
| 11 | EIF3S1 | 6130368 6770044 | 8891 | 0.005 | -0.3812 | No | ||
| 12 | GRM8 | 4780082 | 9375 | 0.004 | -0.4066 | No | ||
| 13 | LHX8 | 5700347 | 9542 | 0.003 | -0.4151 | No | ||
| 14 | ARHGEF12 | 3990195 | 9619 | 0.003 | -0.4187 | No | ||
| 15 | ZBTB33 | 2450014 | 9999 | 0.002 | -0.4389 | No | ||
| 16 | NDST1 | 1500427 5340121 | 10735 | -0.000 | -0.4784 | No | ||
| 17 | GDF8 | 3850504 | 10828 | -0.000 | -0.4834 | No | ||
| 18 | RHOQ | 520161 | 11213 | -0.001 | -0.5038 | No | ||
| 19 | FGF7 | 5390484 | 11592 | -0.003 | -0.5238 | No | ||
| 20 | MITF | 380056 | 12033 | -0.004 | -0.5469 | No | ||
| 21 | PHYHIPL | 2360706 3840692 | 12069 | -0.004 | -0.5482 | No | ||
| 22 | BDNF | 2940128 3520368 | 12639 | -0.007 | -0.5779 | No | ||
| 23 | MAP2K1IP1 | 6110091 | 12877 | -0.008 | -0.5896 | No | ||
| 24 | NUMB | 2450735 3800253 6350040 | 13642 | -0.013 | -0.6289 | No | ||
| 25 | HMGA2 | 2940121 3390647 5130279 6400136 | 13652 | -0.013 | -0.6275 | No | ||
| 26 | GRIA2 | 5080088 | 13763 | -0.014 | -0.6314 | No | ||
| 27 | PIP5K3 | 5360112 | 13770 | -0.014 | -0.6297 | No | ||
| 28 | RAD23B | 2190671 | 13773 | -0.014 | -0.6278 | No | ||
| 29 | UBP1 | 6020707 | 13803 | -0.014 | -0.6273 | No | ||
| 30 | RSBN1 | 7000487 | 13919 | -0.016 | -0.6313 | No | ||
| 31 | SORCS1 | 60411 5890373 | 14083 | -0.018 | -0.6375 | No | ||
| 32 | KLF4 | 1850022 3830239 5570750 | 14192 | -0.019 | -0.6406 | No | ||
| 33 | NONO | 7050014 | 14221 | -0.019 | -0.6393 | No | ||
| 34 | NR4A3 | 2900021 5860095 5910039 | 14482 | -0.024 | -0.6499 | No | ||
| 35 | SEPT7 | 2760685 | 14644 | -0.027 | -0.6547 | No | ||
| 36 | CLASP1 | 6860279 | 15001 | -0.037 | -0.6684 | No | ||
| 37 | PTPN9 | 3290408 | 15031 | -0.039 | -0.6644 | No | ||
| 38 | NLK | 2030010 2450041 | 15071 | -0.040 | -0.6608 | No | ||
| 39 | PURB | 5360138 | 16402 | -0.136 | -0.7127 | Yes | ||
| 40 | EIF2C2 | 770451 | 16805 | -0.197 | -0.7060 | Yes | ||
| 41 | HMGN1 | 2650026 | 17036 | -0.239 | -0.6839 | Yes | ||
| 42 | DNAJB1 | 1090041 | 17157 | -0.264 | -0.6522 | Yes | ||
| 43 | PHTF2 | 6590053 | 17356 | -0.320 | -0.6166 | Yes | ||
| 44 | RNF103 | 840452 | 17676 | -0.419 | -0.5733 | Yes | ||
| 45 | VAPA | 2480594 | 17835 | -0.478 | -0.5128 | Yes | ||
| 46 | RANBP9 | 4670685 | 17870 | -0.489 | -0.4440 | Yes | ||
| 47 | FCHSD2 | 5720092 | 18106 | -0.615 | -0.3679 | Yes | ||
| 48 | ARPP-19 | 5700025 | 18169 | -0.654 | -0.2769 | Yes | ||
| 49 | SATB1 | 5670154 | 18438 | -0.951 | -0.1542 | Yes | ||
| 50 | SFRS1 | 2360440 | 18508 | -1.134 | 0.0058 | Yes |

