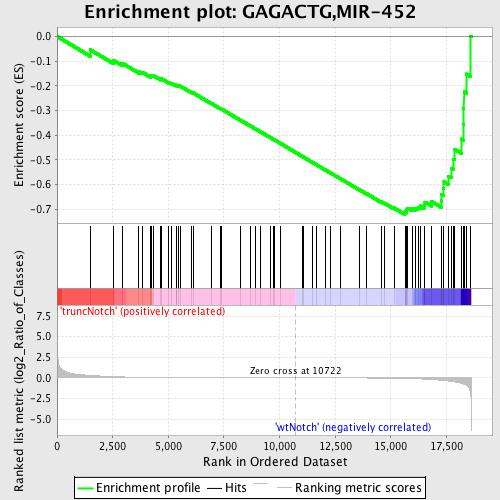
Profile of the Running ES Score & Positions of GeneSet Members on the Rank Ordered List
| Dataset | Set_03_truncNotch_versus_wtNotch.phenotype_truncNotch_versus_wtNotch.cls #truncNotch_versus_wtNotch |
| Phenotype | phenotype_truncNotch_versus_wtNotch.cls#truncNotch_versus_wtNotch |
| Upregulated in class | wtNotch |
| GeneSet | GAGACTG,MIR-452 |
| Enrichment Score (ES) | -0.72166437 |
| Normalized Enrichment Score (NES) | -1.7190992 |
| Nominal p-value | 0.0 |
| FDR q-value | 0.013415323 |
| FWER p-Value | 0.072 |
| PROBE | DESCRIPTION (from dataset) | GENE SYMBOL | GENE_TITLE | RANK IN GENE LIST | RANK METRIC SCORE | RUNNING ES | CORE ENRICHMENT | |
|---|---|---|---|---|---|---|---|---|
| 1 | RBM14 | 5340731 5690315 | 1486 | 0.297 | -0.0539 | No | ||
| 2 | TLN1 | 6590411 | 2536 | 0.149 | -0.0972 | No | ||
| 3 | AXIN2 | 3850131 | 2950 | 0.110 | -0.1097 | No | ||
| 4 | EIF4E | 1580403 70133 6380215 | 3677 | 0.069 | -0.1427 | No | ||
| 5 | DCAMKL1 | 540095 2690092 | 3849 | 0.062 | -0.1465 | No | ||
| 6 | LPHN1 | 1400113 3130301 | 4202 | 0.051 | -0.1609 | No | ||
| 7 | PLXNB1 | 6220273 | 4236 | 0.050 | -0.1583 | No | ||
| 8 | SH3GLB1 | 4590079 5670187 | 4329 | 0.047 | -0.1591 | No | ||
| 9 | PPM1G | 610725 | 4659 | 0.040 | -0.1733 | No | ||
| 10 | ITPKA | 6220075 | 4693 | 0.040 | -0.1716 | No | ||
| 11 | CTBP1 | 3780315 | 5025 | 0.033 | -0.1865 | No | ||
| 12 | MTMR4 | 4540524 | 5132 | 0.032 | -0.1894 | No | ||
| 13 | SYNCRIP | 1690195 3140113 4670279 | 5350 | 0.028 | -0.1986 | No | ||
| 14 | CUGBP1 | 450292 510022 7050176 7050215 | 5365 | 0.028 | -0.1968 | No | ||
| 15 | HOXC8 | 6220050 | 5477 | 0.027 | -0.2005 | No | ||
| 16 | GGA3 | 940082 2480167 | 5560 | 0.026 | -0.2026 | No | ||
| 17 | EEF2 | 1050369 4670035 5890598 | 6055 | 0.020 | -0.2274 | No | ||
| 18 | NXPH1 | 3870546 | 6109 | 0.020 | -0.2285 | No | ||
| 19 | CBX1 | 5080408 1980239 | 6946 | 0.013 | -0.2724 | No | ||
| 20 | FLRT3 | 70685 2760497 6040519 | 7341 | 0.011 | -0.2927 | No | ||
| 21 | PPM2C | 3360209 | 7397 | 0.011 | -0.2946 | No | ||
| 22 | MEIS1 | 1400575 | 8236 | 0.008 | -0.3391 | No | ||
| 23 | BCL2L2 | 2760692 6770739 | 8680 | 0.006 | -0.3625 | No | ||
| 24 | ABCC5 | 2100600 5050692 | 8895 | 0.005 | -0.3736 | No | ||
| 25 | ACVR2A | 6110647 | 9155 | 0.004 | -0.3871 | No | ||
| 26 | EPHB3 | 6650341 | 9599 | 0.003 | -0.4107 | No | ||
| 27 | CILP | 4590037 | 9703 | 0.003 | -0.4160 | No | ||
| 28 | DYNLL1 | 5570113 | 9770 | 0.003 | -0.4194 | No | ||
| 29 | ZIC1 | 670113 | 10040 | 0.002 | -0.4337 | No | ||
| 30 | PRICKLE2 | 780408 | 11009 | -0.001 | -0.4858 | No | ||
| 31 | SLC25A27 | 6200707 6940019 | 11096 | -0.001 | -0.4904 | No | ||
| 32 | TAF4 | 1450170 | 11457 | -0.002 | -0.5096 | No | ||
| 33 | LZTS1 | 4150088 | 11649 | -0.003 | -0.5196 | No | ||
| 34 | NPEPPS | 2630731 | 12053 | -0.004 | -0.5410 | No | ||
| 35 | GPR126 | 6650204 | 12277 | -0.005 | -0.5526 | No | ||
| 36 | DPP10 | 4730746 | 12732 | -0.007 | -0.5764 | No | ||
| 37 | PLA2G4A | 6380364 | 13583 | -0.012 | -0.6212 | No | ||
| 38 | RSBN1 | 7000487 | 13919 | -0.016 | -0.6379 | No | ||
| 39 | PRRX1 | 4120193 4480390 | 14562 | -0.025 | -0.6702 | No | ||
| 40 | TNRC15 | 6760746 | 14709 | -0.029 | -0.6756 | No | ||
| 41 | CALU | 2680403 3520056 4610348 5720176 6130121 | 15145 | -0.043 | -0.6952 | No | ||
| 42 | EN1 | 5360168 7050025 | 15637 | -0.069 | -0.7156 | Yes | ||
| 43 | RAB8B | 510692 1980017 3130136 4570739 | 15660 | -0.071 | -0.7105 | Yes | ||
| 44 | DYRK1A | 3190181 | 15694 | -0.073 | -0.7059 | Yes | ||
| 45 | P4HA1 | 2630692 | 15720 | -0.075 | -0.7006 | Yes | ||
| 46 | MOBKL2B | 940128 | 15760 | -0.078 | -0.6958 | Yes | ||
| 47 | PPP1R12A | 4070066 4590162 | 15977 | -0.094 | -0.6991 | Yes | ||
| 48 | ZDHHC5 | 1690711 | 16093 | -0.104 | -0.6962 | Yes | ||
| 49 | TCF20 | 1190338 1240520 4070594 4810440 | 16222 | -0.117 | -0.6927 | Yes | ||
| 50 | SLC6A9 | 2470520 | 16327 | -0.128 | -0.6871 | Yes | ||
| 51 | LDB1 | 5270601 | 16494 | -0.150 | -0.6828 | Yes | ||
| 52 | HIP2 | 2810095 3990369 4120301 | 16533 | -0.155 | -0.6712 | Yes | ||
| 53 | SP1 | 6590017 | 16838 | -0.205 | -0.6695 | Yes | ||
| 54 | CDC42EP3 | 2480138 | 17261 | -0.292 | -0.6665 | Yes | ||
| 55 | BCAS3 | 4050647 | 17283 | -0.299 | -0.6412 | Yes | ||
| 56 | RAB35 | 630056 | 17365 | -0.322 | -0.6171 | Yes | ||
| 57 | TCF4 | 520021 | 17388 | -0.328 | -0.5894 | Yes | ||
| 58 | PAIP2 | 4210441 | 17597 | -0.387 | -0.5664 | Yes | ||
| 59 | ADIPOR2 | 1510035 | 17721 | -0.433 | -0.5348 | Yes | ||
| 60 | MAPK6 | 6760520 | 17829 | -0.477 | -0.4985 | Yes | ||
| 61 | RORC | 1740121 | 17872 | -0.490 | -0.4575 | Yes | ||
| 62 | OGT | 2360131 4610333 | 18167 | -0.653 | -0.4156 | Yes | ||
| 63 | PPP2CA | 3990113 | 18255 | -0.725 | -0.3563 | Yes | ||
| 64 | GTF2E1 | 4070014 | 18278 | -0.752 | -0.2910 | Yes | ||
| 65 | RHOT1 | 6760692 | 18289 | -0.763 | -0.2242 | Yes | ||
| 66 | TCF12 | 3610324 7000156 | 18397 | -0.880 | -0.1522 | Yes | ||
| 67 | CNOT7 | 2450338 5720397 | 18593 | -1.857 | 0.0012 | Yes |

