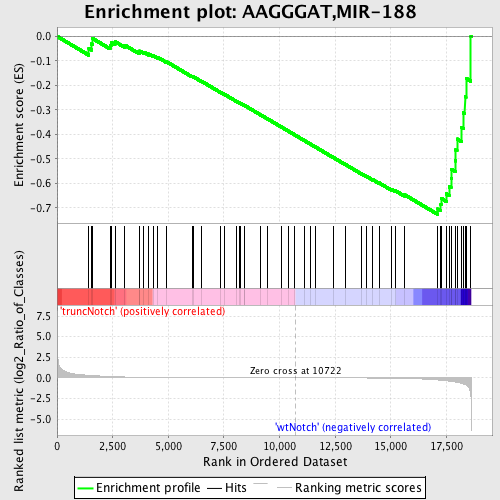
Profile of the Running ES Score & Positions of GeneSet Members on the Rank Ordered List
| Dataset | Set_03_truncNotch_versus_wtNotch.phenotype_truncNotch_versus_wtNotch.cls #truncNotch_versus_wtNotch |
| Phenotype | phenotype_truncNotch_versus_wtNotch.cls#truncNotch_versus_wtNotch |
| Upregulated in class | wtNotch |
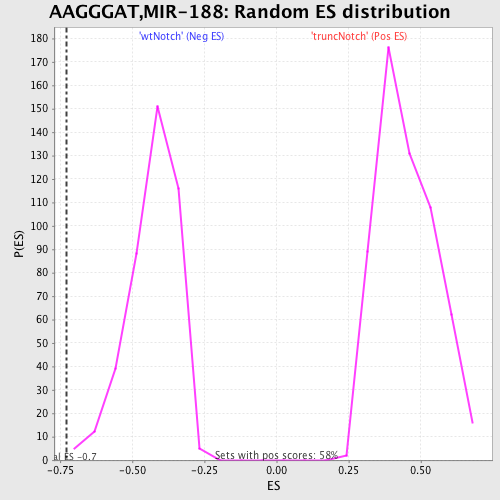
| GeneSet | AAGGGAT,MIR-188 |
| Enrichment Score (ES) | -0.7267486 |
| Normalized Enrichment Score (NES) | -1.6918384 |
| Nominal p-value | 0.0024038462 |
| FDR q-value | 0.020306898 |
| FWER p-Value | 0.128 |
| PROBE | DESCRIPTION (from dataset) | GENE SYMBOL | GENE_TITLE | RANK IN GENE LIST | RANK METRIC SCORE | RUNNING ES | CORE ENRICHMENT | |
|---|---|---|---|---|---|---|---|---|
| 1 | CDC25B | 6940102 | 1428 | 0.308 | -0.0498 | No | ||
| 2 | MAP3K3 | 610685 | 1546 | 0.286 | -0.0308 | No | ||
| 3 | DEDD | 6400131 | 1586 | 0.280 | -0.0083 | No | ||
| 4 | P4HB | 6110056 | 2385 | 0.166 | -0.0367 | No | ||
| 5 | BCL9 | 7100112 | 2431 | 0.161 | -0.0249 | No | ||
| 6 | ACACA | 2490612 2680369 | 2604 | 0.142 | -0.0217 | No | ||
| 7 | DLG5 | 450215 | 3034 | 0.104 | -0.0356 | No | ||
| 8 | FBXW7 | 4210338 7050280 | 3694 | 0.069 | -0.0651 | No | ||
| 9 | ATXN1 | 5550156 | 3707 | 0.068 | -0.0597 | No | ||
| 10 | CNIH | 2190484 5080609 | 3901 | 0.060 | -0.0648 | No | ||
| 11 | PDE4A | 1190619 1340129 5720100 6370035 | 4119 | 0.054 | -0.0718 | No | ||
| 12 | RSPO3 | 7550703 6840435 | 4324 | 0.047 | -0.0786 | No | ||
| 13 | LUZP1 | 940075 4280458 6180070 | 4531 | 0.043 | -0.0859 | No | ||
| 14 | SLC12A2 | 4610019 6040672 | 4897 | 0.036 | -0.1024 | No | ||
| 15 | PHACTR2 | 1580154 | 6068 | 0.020 | -0.1637 | No | ||
| 16 | KLF12 | 1660095 4810288 5340546 6520286 | 6125 | 0.020 | -0.1649 | No | ||
| 17 | CHRD | 3140368 | 6479 | 0.017 | -0.1825 | No | ||
| 18 | MEF2C | 670025 780338 | 7333 | 0.011 | -0.2274 | No | ||
| 19 | CGN | 5890139 6370167 6400537 | 7506 | 0.011 | -0.2358 | No | ||
| 20 | IL13RA1 | 5550609 | 8075 | 0.008 | -0.2657 | No | ||
| 21 | AP1S3 | 510594 1450242 2190576 | 8193 | 0.008 | -0.2713 | No | ||
| 22 | EDG2 | 6290215 | 8239 | 0.008 | -0.2730 | No | ||
| 23 | PCDH9 | 2100136 | 8403 | 0.007 | -0.2812 | No | ||
| 24 | CXXC5 | 840010 | 8418 | 0.007 | -0.2814 | No | ||
| 25 | CPNE8 | 7040039 | 9158 | 0.004 | -0.3208 | No | ||
| 26 | SLITRK4 | 5910022 | 9456 | 0.004 | -0.3365 | No | ||
| 27 | ESR1 | 4060372 5860193 | 10107 | 0.002 | -0.3713 | No | ||
| 28 | HNT | 6450731 | 10405 | 0.001 | -0.3873 | No | ||
| 29 | SPRED1 | 6940706 | 10651 | 0.000 | -0.4005 | No | ||
| 30 | MAFB | 1230471 | 11103 | -0.001 | -0.4247 | No | ||
| 31 | MAPK8IP2 | 630373 | 11396 | -0.002 | -0.4402 | No | ||
| 32 | KITLG | 2120047 6220300 | 11621 | -0.003 | -0.4521 | No | ||
| 33 | EPHA4 | 460750 | 12408 | -0.005 | -0.4939 | No | ||
| 34 | UBE2I | 2680056 6350446 | 12940 | -0.008 | -0.5218 | No | ||
| 35 | EFNB2 | 5340136 | 13691 | -0.013 | -0.5611 | No | ||
| 36 | USP28 | 1450010 | 13894 | -0.015 | -0.5706 | No | ||
| 37 | CCNT2 | 2100390 4150563 | 14196 | -0.019 | -0.5851 | No | ||
| 38 | KPNA3 | 7040088 | 14468 | -0.023 | -0.5977 | No | ||
| 39 | COVA1 | 5340504 5360594 | 15024 | -0.038 | -0.6242 | No | ||
| 40 | RAB6IP1 | 4150044 | 15208 | -0.046 | -0.6300 | No | ||
| 41 | RNF111 | 2970072 3140112 5130647 | 15610 | -0.067 | -0.6457 | No | ||
| 42 | PTEN | 3390064 | 17115 | -0.256 | -0.7042 | Yes | ||
| 43 | TOMM70A | 780114 | 17248 | -0.287 | -0.6859 | Yes | ||
| 44 | ELOVL6 | 5340746 | 17264 | -0.293 | -0.6609 | Yes | ||
| 45 | SFRS7 | 2760408 | 17496 | -0.354 | -0.6422 | Yes | ||
| 46 | CRKL | 4050427 | 17622 | -0.398 | -0.6138 | Yes | ||
| 47 | EIF4A1 | 1990341 2810300 | 17709 | -0.427 | -0.5808 | Yes | ||
| 48 | EPC2 | 2470095 | 17729 | -0.437 | -0.5432 | Yes | ||
| 49 | SOX4 | 2260091 | 17896 | -0.506 | -0.5075 | Yes | ||
| 50 | BCL11B | 2680673 | 17919 | -0.514 | -0.4634 | Yes | ||
| 51 | TRIP12 | 130154 5080288 5720446 | 17977 | -0.542 | -0.4187 | Yes | ||
| 52 | RAB14 | 6860139 | 18176 | -0.658 | -0.3714 | Yes | ||
| 53 | H3F3B | 1410300 | 18257 | -0.727 | -0.3116 | Yes | ||
| 54 | RAP2C | 1690132 | 18334 | -0.799 | -0.2452 | Yes | ||
| 55 | MBNL1 | 2640762 7100048 | 18381 | -0.865 | -0.1714 | Yes | ||
| 56 | ILF3 | 940722 3190647 6520110 | 18599 | -2.087 | 0.0009 | Yes |