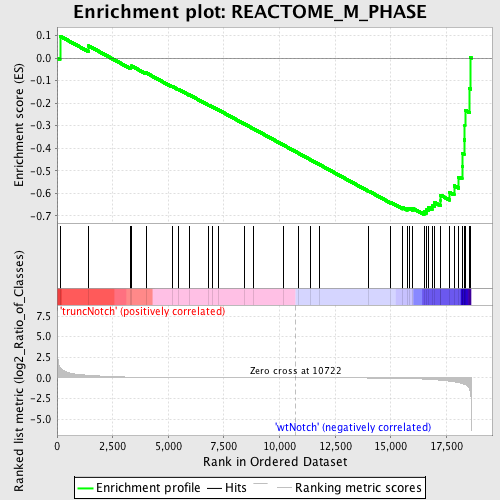
Profile of the Running ES Score & Positions of GeneSet Members on the Rank Ordered List
| Dataset | Set_03_truncNotch_versus_wtNotch.phenotype_truncNotch_versus_wtNotch.cls #truncNotch_versus_wtNotch |
| Phenotype | phenotype_truncNotch_versus_wtNotch.cls#truncNotch_versus_wtNotch |
| Upregulated in class | wtNotch |
| GeneSet | REACTOME_M_PHASE |
| Enrichment Score (ES) | -0.6941187 |
| Normalized Enrichment Score (NES) | -1.5281053 |
| Nominal p-value | 0.015765766 |
| FDR q-value | 0.52805537 |
| FWER p-Value | 0.99 |
| PROBE | DESCRIPTION (from dataset) | GENE SYMBOL | GENE_TITLE | RANK IN GENE LIST | RANK METRIC SCORE | RUNNING ES | CORE ENRICHMENT | |
|---|---|---|---|---|---|---|---|---|
| 1 | RANGAP1 | 2320593 6650601 | 130 | 1.244 | 0.0975 | No | ||
| 2 | PMF1 | 5130273 | 1421 | 0.310 | 0.0540 | No | ||
| 3 | BUB3 | 3170546 | 3320 | 0.087 | -0.0409 | No | ||
| 4 | CDC20 | 3440017 3440044 6220088 | 3342 | 0.085 | -0.0348 | No | ||
| 5 | KIF2B | 5700066 | 4000 | 0.058 | -0.0654 | No | ||
| 6 | KIF20A | 2650050 | 5168 | 0.031 | -0.1256 | No | ||
| 7 | PLK1 | 1780369 2640121 | 5459 | 0.027 | -0.1389 | No | ||
| 8 | CENPE | 2850022 | 5930 | 0.021 | -0.1624 | No | ||
| 9 | CLIP1 | 2850162 6770397 | 6821 | 0.014 | -0.2091 | No | ||
| 10 | NUP37 | 2370097 6370435 6380008 | 7003 | 0.013 | -0.2178 | No | ||
| 11 | PAFAH1B1 | 4230333 6420121 6450066 | 7240 | 0.012 | -0.2295 | No | ||
| 12 | SGOL1 | 1980075 5220092 6020711 | 8414 | 0.007 | -0.2920 | No | ||
| 13 | KIF2A | 3990286 6130575 | 8828 | 0.005 | -0.3138 | No | ||
| 14 | BUB1 | 5390270 | 10161 | 0.002 | -0.3854 | No | ||
| 15 | XPO1 | 540707 | 10862 | -0.000 | -0.4230 | No | ||
| 16 | CLASP2 | 2510139 | 11410 | -0.002 | -0.4523 | No | ||
| 17 | CENPC1 | 610273 | 11785 | -0.003 | -0.4722 | No | ||
| 18 | MLF1IP | 3610367 | 14012 | -0.017 | -0.5906 | No | ||
| 19 | CLASP1 | 6860279 | 15001 | -0.037 | -0.6406 | No | ||
| 20 | PPP1CC | 6380300 2510647 | 15544 | -0.063 | -0.6645 | No | ||
| 21 | RANBP2 | 4280338 | 15730 | -0.075 | -0.6681 | No | ||
| 22 | STAG2 | 4540132 | 15837 | -0.084 | -0.6668 | No | ||
| 23 | SEC13 | 380577 | 15988 | -0.095 | -0.6669 | No | ||
| 24 | RAD21 | 1990278 | 16495 | -0.150 | -0.6816 | Yes | ||
| 25 | CENPA | 5080154 | 16612 | -0.168 | -0.6737 | Yes | ||
| 26 | KNTC1 | 430079 | 16683 | -0.178 | -0.6626 | Yes | ||
| 27 | BIRC5 | 110408 580014 1770632 | 16855 | -0.207 | -0.6544 | Yes | ||
| 28 | NUP43 | 3360482 | 16960 | -0.224 | -0.6411 | Yes | ||
| 29 | NDC80 | 4120465 | 17235 | -0.283 | -0.6321 | Yes | ||
| 30 | ZWINT | 6940670 | 17240 | -0.284 | -0.6084 | Yes | ||
| 31 | SGOL2 | 2030338 | 17643 | -0.408 | -0.5958 | Yes | ||
| 32 | NUP107 | 6380021 | 17844 | -0.482 | -0.5661 | Yes | ||
| 33 | MAD2L1 | 4480725 | 18047 | -0.583 | -0.5280 | Yes | ||
| 34 | NUP160 | 1990551 | 18202 | -0.673 | -0.4798 | Yes | ||
| 35 | BUB1B | 1450288 | 18215 | -0.685 | -0.4229 | Yes | ||
| 36 | MAPRE1 | 3290037 | 18295 | -0.767 | -0.3627 | Yes | ||
| 37 | KIF23 | 5570112 | 18328 | -0.792 | -0.2980 | Yes | ||
| 38 | ZW10 | 2900735 3520687 | 18335 | -0.804 | -0.2308 | Yes | ||
| 39 | SMC1A | 3060600 5700148 5890113 6370154 | 18529 | -1.261 | -0.1353 | Yes | ||
| 40 | CDCA8 | 2340286 6980019 | 18575 | -1.667 | 0.0022 | Yes |

