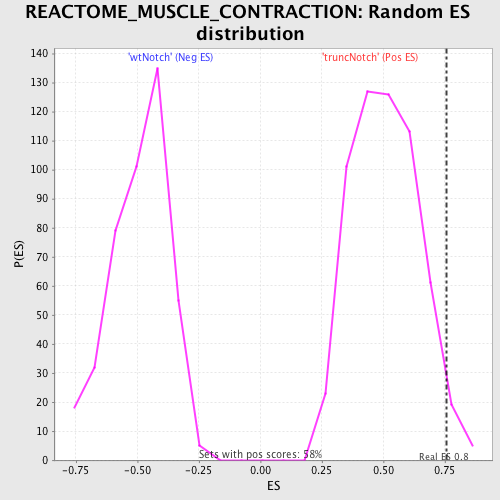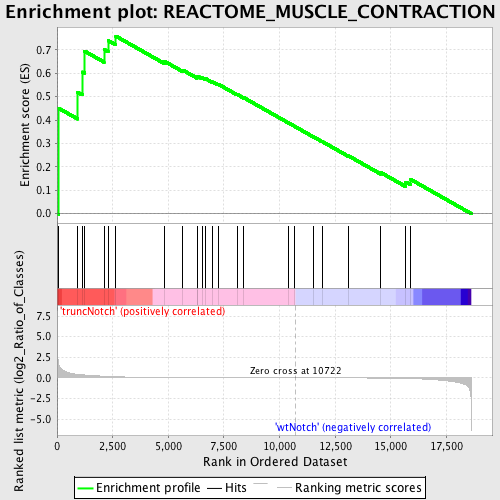
Profile of the Running ES Score & Positions of GeneSet Members on the Rank Ordered List
| Dataset | Set_03_truncNotch_versus_wtNotch.phenotype_truncNotch_versus_wtNotch.cls #truncNotch_versus_wtNotch |
| Phenotype | phenotype_truncNotch_versus_wtNotch.cls#truncNotch_versus_wtNotch |
| Upregulated in class | truncNotch |
| GeneSet | REACTOME_MUSCLE_CONTRACTION |
| Enrichment Score (ES) | 0.7588692 |
| Normalized Enrichment Score (NES) | 1.498125 |
| Nominal p-value | 0.026086956 |
| FDR q-value | 0.37424922 |
| FWER p-Value | 0.999 |
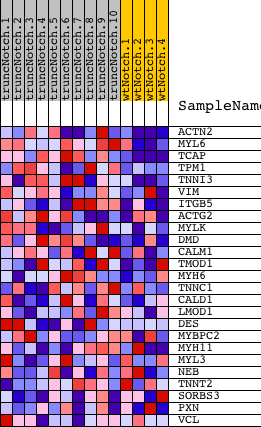
| PROBE | DESCRIPTION (from dataset) | GENE SYMBOL | GENE_TITLE | RANK IN GENE LIST | RANK METRIC SCORE | RUNNING ES | CORE ENRICHMENT | |
|---|---|---|---|---|---|---|---|---|
| 1 | ACTN2 | 4200435 | 63 | 1.683 | 0.4510 | Yes | ||
| 2 | MYL6 | 60563 6100152 | 928 | 0.423 | 0.5188 | Yes | ||
| 3 | TCAP | 4890446 | 1141 | 0.364 | 0.6055 | Yes | ||
| 4 | TPM1 | 130673 | 1229 | 0.349 | 0.6950 | Yes | ||
| 5 | TNNI3 | 7000093 | 2111 | 0.201 | 0.7019 | Yes | ||
| 6 | VIM | 20431 | 2295 | 0.177 | 0.7399 | Yes | ||
| 7 | ITGB5 | 70129 | 2639 | 0.139 | 0.7589 | Yes | ||
| 8 | ACTG2 | 4780180 | 4827 | 0.037 | 0.6512 | No | ||
| 9 | MYLK | 4010600 7000364 | 5653 | 0.025 | 0.6134 | No | ||
| 10 | DMD | 1740041 3990332 | 6288 | 0.018 | 0.5842 | No | ||
| 11 | CALM1 | 380128 | 6325 | 0.018 | 0.5872 | No | ||
| 12 | TMOD1 | 3850100 | 6534 | 0.016 | 0.5804 | No | ||
| 13 | MYH6 | 2900373 | 6648 | 0.015 | 0.5785 | No | ||
| 14 | TNNC1 | 1990575 | 7001 | 0.013 | 0.5631 | No | ||
| 15 | CALD1 | 1770129 1940397 | 7234 | 0.012 | 0.5538 | No | ||
| 16 | LMOD1 | 2120035 | 8088 | 0.008 | 0.5101 | No | ||
| 17 | DES | 1450341 | 8398 | 0.007 | 0.4954 | No | ||
| 18 | MYBPC2 | 1980368 | 10390 | 0.001 | 0.3885 | No | ||
| 19 | MYH11 | 7100273 | 10648 | 0.000 | 0.3748 | No | ||
| 20 | MYL3 | 6040563 | 11536 | -0.002 | 0.3277 | No | ||
| 21 | NEB | 580735 | 11923 | -0.004 | 0.3079 | No | ||
| 22 | TNNT2 | 2450364 | 13099 | -0.009 | 0.2471 | No | ||
| 23 | SORBS3 | 50465 | 14547 | -0.025 | 0.1761 | No | ||
| 24 | PXN | 3290048 6400132 | 15666 | -0.071 | 0.1350 | No | ||
| 25 | VCL | 4120487 | 15892 | -0.087 | 0.1465 | No |