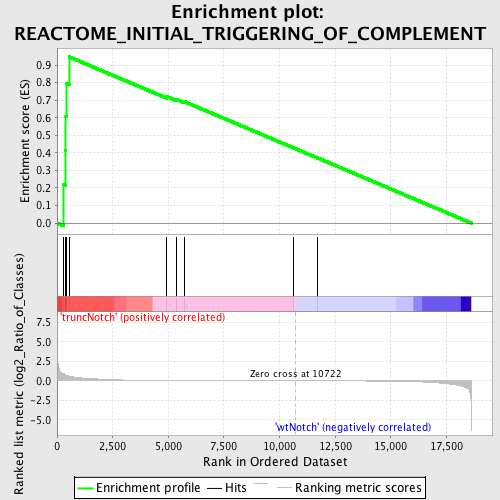
Profile of the Running ES Score & Positions of GeneSet Members on the Rank Ordered List
| Dataset | Set_03_truncNotch_versus_wtNotch.phenotype_truncNotch_versus_wtNotch.cls #truncNotch_versus_wtNotch |
| Phenotype | phenotype_truncNotch_versus_wtNotch.cls#truncNotch_versus_wtNotch |
| Upregulated in class | truncNotch |
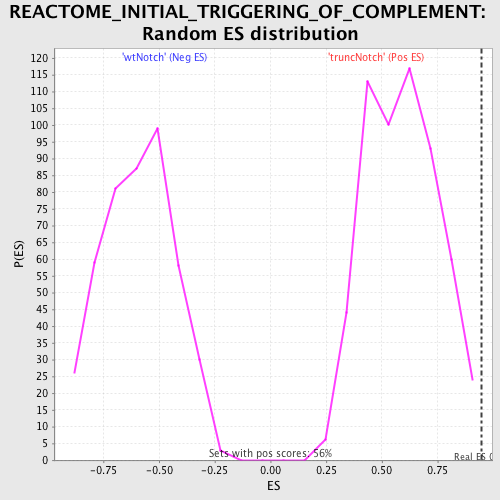
| GeneSet | REACTOME_INITIAL_TRIGGERING_OF_COMPLEMENT |
| Enrichment Score (ES) | 0.9471697 |
| Normalized Enrichment Score (NES) | 1.6038318 |
| Nominal p-value | 0.0017953322 |
| FDR q-value | 0.26203477 |
| FWER p-Value | 0.753 |
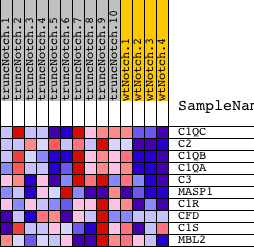
| PROBE | DESCRIPTION (from dataset) | GENE SYMBOL | GENE_TITLE | RANK IN GENE LIST | RANK METRIC SCORE | RUNNING ES | CORE ENRICHMENT | |
|---|---|---|---|---|---|---|---|---|
| 1 | C1QC | 5700131 | 304 | 0.890 | 0.2180 | Yes | ||
| 2 | C2 | 5390465 | 378 | 0.760 | 0.4143 | Yes | ||
| 3 | C1QB | 5910292 | 396 | 0.735 | 0.6071 | Yes | ||
| 4 | C1QA | 5390687 | 407 | 0.722 | 0.7967 | Yes | ||
| 5 | C3 | 1740372 | 544 | 0.599 | 0.9472 | Yes | ||
| 6 | MASP1 | 1780619 2900066 | 4935 | 0.035 | 0.7205 | No | ||
| 7 | C1R | 2340025 3290152 4850452 | 5352 | 0.028 | 0.7056 | No | ||
| 8 | CFD | 2320736 | 5716 | 0.024 | 0.6923 | No | ||
| 9 | C1S | 840184 6840114 | 10626 | 0.000 | 0.4286 | No | ||
| 10 | MBL2 | 6370446 | 11706 | -0.003 | 0.3714 | No |