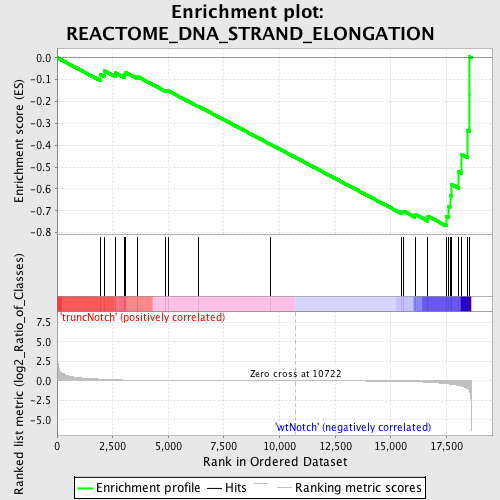
Profile of the Running ES Score & Positions of GeneSet Members on the Rank Ordered List
| Dataset | Set_03_truncNotch_versus_wtNotch.phenotype_truncNotch_versus_wtNotch.cls #truncNotch_versus_wtNotch |
| Phenotype | phenotype_truncNotch_versus_wtNotch.cls#truncNotch_versus_wtNotch |
| Upregulated in class | wtNotch |
| GeneSet | REACTOME_DNA_STRAND_ELONGATION |
| Enrichment Score (ES) | -0.7697442 |
| Normalized Enrichment Score (NES) | -1.5309078 |
| Nominal p-value | 0.009090909 |
| FDR q-value | 0.5604412 |
| FWER p-Value | 0.988 |
| PROBE | DESCRIPTION (from dataset) | GENE SYMBOL | GENE_TITLE | RANK IN GENE LIST | RANK METRIC SCORE | RUNNING ES | CORE ENRICHMENT | |
|---|---|---|---|---|---|---|---|---|
| 1 | RFC5 | 3800452 6020091 | 1934 | 0.225 | -0.0753 | No | ||
| 2 | POLD1 | 4830026 | 2120 | 0.200 | -0.0598 | No | ||
| 3 | LIG1 | 1980438 4540112 5570609 | 2620 | 0.140 | -0.0687 | No | ||
| 4 | POLD2 | 6400148 | 3013 | 0.106 | -0.0763 | No | ||
| 5 | MCM2 | 5050139 | 3062 | 0.103 | -0.0658 | No | ||
| 6 | MCM5 | 2680647 | 3628 | 0.071 | -0.0871 | No | ||
| 7 | MCM3 | 5570068 | 4864 | 0.036 | -0.1489 | No | ||
| 8 | POLA2 | 940519 | 4991 | 0.034 | -0.1514 | No | ||
| 9 | RFC3 | 1980600 | 6368 | 0.018 | -0.2231 | No | ||
| 10 | POLA1 | 4760541 | 9613 | 0.003 | -0.3972 | No | ||
| 11 | FEN1 | 1770541 | 15483 | -0.059 | -0.7052 | No | ||
| 12 | RPA2 | 2760301 5420195 | 15573 | -0.065 | -0.7017 | No | ||
| 13 | MCM7 | 3290292 5220056 | 16086 | -0.103 | -0.7161 | No | ||
| 14 | PRIM1 | 6420746 | 16667 | -0.175 | -0.7248 | Yes | ||
| 15 | RPA3 | 5700136 | 17503 | -0.356 | -0.7243 | Yes | ||
| 16 | POLD3 | 6400278 | 17603 | -0.388 | -0.6800 | Yes | ||
| 17 | PCNA | 940754 | 17662 | -0.414 | -0.6303 | Yes | ||
| 18 | RPA1 | 360452 | 17708 | -0.427 | -0.5782 | Yes | ||
| 19 | RFC1 | 1190673 | 18057 | -0.589 | -0.5217 | Yes | ||
| 20 | CDC45L | 70537 3130114 | 18193 | -0.667 | -0.4437 | Yes | ||
| 21 | MCM6 | 60092 540181 6510110 | 18453 | -0.990 | -0.3312 | Yes | ||
| 22 | MCM4 | 2760673 5420711 | 18538 | -1.324 | -0.1667 | Yes | ||
| 23 | RFC4 | 3800082 6840142 | 18540 | -1.338 | 0.0041 | Yes |

