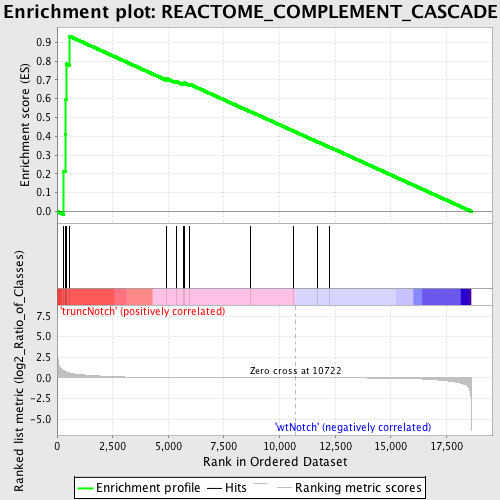
Profile of the Running ES Score & Positions of GeneSet Members on the Rank Ordered List
| Dataset | Set_03_truncNotch_versus_wtNotch.phenotype_truncNotch_versus_wtNotch.cls #truncNotch_versus_wtNotch |
| Phenotype | phenotype_truncNotch_versus_wtNotch.cls#truncNotch_versus_wtNotch |
| Upregulated in class | truncNotch |
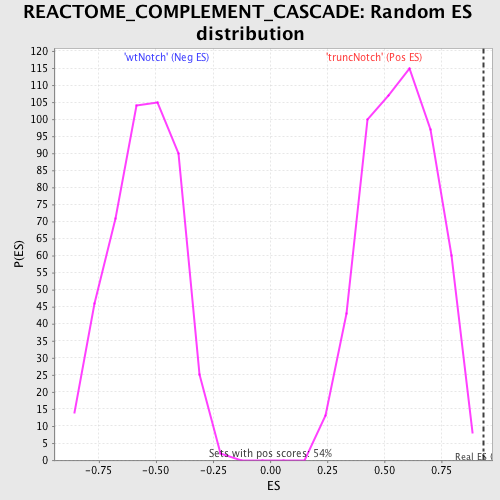
| GeneSet | REACTOME_COMPLEMENT_CASCADE |
| Enrichment Score (ES) | 0.93290067 |
| Normalized Enrichment Score (NES) | 1.6467942 |
| Nominal p-value | 0.0 |
| FDR q-value | 0.2799046 |
| FWER p-Value | 0.455 |
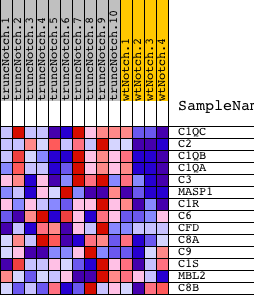
| PROBE | DESCRIPTION (from dataset) | GENE SYMBOL | GENE_TITLE | RANK IN GENE LIST | RANK METRIC SCORE | RUNNING ES | CORE ENRICHMENT | |
|---|---|---|---|---|---|---|---|---|
| 1 | C1QC | 5700131 | 304 | 0.890 | 0.2146 | Yes | ||
| 2 | C2 | 5390465 | 378 | 0.760 | 0.4080 | Yes | ||
| 3 | C1QB | 5910292 | 396 | 0.735 | 0.5979 | Yes | ||
| 4 | C1QA | 5390687 | 407 | 0.722 | 0.7847 | Yes | ||
| 5 | C3 | 1740372 | 544 | 0.599 | 0.9329 | Yes | ||
| 6 | MASP1 | 1780619 2900066 | 4935 | 0.035 | 0.7060 | No | ||
| 7 | C1R | 2340025 3290152 4850452 | 5352 | 0.028 | 0.6910 | No | ||
| 8 | C6 | 1770154 2900129 | 5689 | 0.024 | 0.6792 | No | ||
| 9 | CFD | 2320736 | 5716 | 0.024 | 0.6840 | No | ||
| 10 | C8A | 2190601 | 5934 | 0.021 | 0.6779 | No | ||
| 11 | C9 | 5550452 5690253 | 8682 | 0.006 | 0.5317 | No | ||
| 12 | C1S | 840184 6840114 | 10626 | 0.000 | 0.4274 | No | ||
| 13 | MBL2 | 6370446 | 11706 | -0.003 | 0.3701 | No | ||
| 14 | C8B | 6770687 | 12256 | -0.005 | 0.3419 | No |