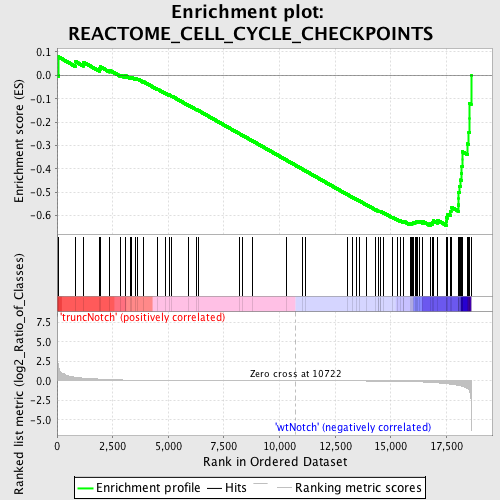
Profile of the Running ES Score & Positions of GeneSet Members on the Rank Ordered List
| Dataset | Set_03_truncNotch_versus_wtNotch.phenotype_truncNotch_versus_wtNotch.cls #truncNotch_versus_wtNotch |
| Phenotype | phenotype_truncNotch_versus_wtNotch.cls#truncNotch_versus_wtNotch |
| Upregulated in class | wtNotch |
| GeneSet | REACTOME_CELL_CYCLE_CHECKPOINTS |
| Enrichment Score (ES) | -0.6439006 |
| Normalized Enrichment Score (NES) | -1.6122955 |
| Nominal p-value | 0.0023419203 |
| FDR q-value | 0.41554156 |
| FWER p-Value | 0.79 |
| PROBE | DESCRIPTION (from dataset) | GENE SYMBOL | GENE_TITLE | RANK IN GENE LIST | RANK METRIC SCORE | RUNNING ES | CORE ENRICHMENT | |
|---|---|---|---|---|---|---|---|---|
| 1 | PSMA1 | 380059 2760195 | 58 | 1.771 | 0.0792 | No | ||
| 2 | PSMC1 | 6350538 | 834 | 0.457 | 0.0587 | No | ||
| 3 | PSMD2 | 4670706 5050364 | 1184 | 0.356 | 0.0564 | No | ||
| 4 | PSMD9 | 50020 5890368 | 1910 | 0.229 | 0.0280 | No | ||
| 5 | RFC5 | 3800452 6020091 | 1934 | 0.225 | 0.0372 | No | ||
| 6 | PSMA7 | 2230131 | 2358 | 0.169 | 0.0222 | No | ||
| 7 | PSMB6 | 2690711 | 2844 | 0.118 | 0.0016 | No | ||
| 8 | MCM2 | 5050139 | 3062 | 0.103 | -0.0053 | No | ||
| 9 | PSMB10 | 630504 6510039 | 3078 | 0.102 | -0.0014 | No | ||
| 10 | BUB3 | 3170546 | 3320 | 0.087 | -0.0104 | No | ||
| 11 | CDC20 | 3440017 3440044 6220088 | 3342 | 0.085 | -0.0075 | No | ||
| 12 | TP53 | 6130707 | 3540 | 0.075 | -0.0147 | No | ||
| 13 | MCM5 | 2680647 | 3628 | 0.071 | -0.0161 | No | ||
| 14 | PSMB3 | 4280594 | 3887 | 0.061 | -0.0272 | No | ||
| 15 | PSMA5 | 5390537 | 4502 | 0.044 | -0.0583 | No | ||
| 16 | MCM3 | 5570068 | 4864 | 0.036 | -0.0760 | No | ||
| 17 | RAD1 | 4200551 | 5030 | 0.033 | -0.0834 | No | ||
| 18 | UBE2C | 6130017 | 5158 | 0.031 | -0.0888 | No | ||
| 19 | PSMB4 | 520402 | 5907 | 0.022 | -0.1281 | No | ||
| 20 | PSMB9 | 6980471 | 6277 | 0.018 | -0.1472 | No | ||
| 21 | RFC3 | 1980600 | 6368 | 0.018 | -0.1512 | No | ||
| 22 | PSMA3 | 5900047 7040161 | 8190 | 0.008 | -0.2491 | No | ||
| 23 | PSMC3 | 2480184 | 8313 | 0.007 | -0.2553 | No | ||
| 24 | PSMD5 | 3940139 4570041 | 8779 | 0.006 | -0.2801 | No | ||
| 25 | PSMA6 | 50609 | 10313 | 0.001 | -0.3627 | No | ||
| 26 | PSMD8 | 630142 | 11012 | -0.001 | -0.4004 | No | ||
| 27 | UBE2D1 | 1850400 | 11163 | -0.001 | -0.4084 | No | ||
| 28 | CCNB2 | 6510528 | 13033 | -0.009 | -0.5088 | No | ||
| 29 | CHEK1 | 50167 1940300 | 13273 | -0.010 | -0.5212 | No | ||
| 30 | CDKN1A | 4050088 6400706 | 13471 | -0.011 | -0.5313 | No | ||
| 31 | PSMD11 | 2340538 6510053 | 13573 | -0.012 | -0.5362 | No | ||
| 32 | ATM | 3610110 4050524 | 13898 | -0.015 | -0.5529 | No | ||
| 33 | CDC25C | 2570673 4760161 6520707 | 14329 | -0.021 | -0.5751 | No | ||
| 34 | MCM10 | 4920632 | 14437 | -0.023 | -0.5798 | No | ||
| 35 | PSMB5 | 6290242 | 14459 | -0.023 | -0.5799 | No | ||
| 36 | ORC2L | 1990470 6510019 | 14531 | -0.025 | -0.5826 | No | ||
| 37 | PSMC2 | 7040010 | 14539 | -0.025 | -0.5818 | No | ||
| 38 | WEE1 | 3390070 | 14671 | -0.027 | -0.5876 | No | ||
| 39 | ORC1L | 2370328 6110390 | 15055 | -0.039 | -0.6064 | No | ||
| 40 | CDK2 | 130484 2260301 4010088 5050110 | 15285 | -0.049 | -0.6165 | No | ||
| 41 | PSMB1 | 2940402 | 15414 | -0.055 | -0.6208 | No | ||
| 42 | MDM2 | 3450053 5080138 | 15571 | -0.065 | -0.6262 | No | ||
| 43 | RPA2 | 2760301 5420195 | 15573 | -0.065 | -0.6232 | No | ||
| 44 | ORC4L | 4230538 5550288 | 15863 | -0.085 | -0.6349 | No | ||
| 45 | PSME3 | 2810537 | 15913 | -0.089 | -0.6334 | No | ||
| 46 | HUS1 | 3440494 3800156 | 15954 | -0.092 | -0.6312 | No | ||
| 47 | PSMC6 | 2810021 | 16015 | -0.097 | -0.6299 | No | ||
| 48 | MCM7 | 3290292 5220056 | 16086 | -0.103 | -0.6289 | No | ||
| 49 | CDC25A | 3800184 | 16131 | -0.107 | -0.6263 | No | ||
| 50 | PSMC5 | 2760315 6550021 | 16184 | -0.113 | -0.6239 | No | ||
| 51 | RAD9B | 2320064 | 16306 | -0.126 | -0.6245 | No | ||
| 52 | PSMD3 | 1400647 | 16442 | -0.142 | -0.6252 | No | ||
| 53 | CDC16 | 1940706 | 16789 | -0.194 | -0.6349 | Yes | ||
| 54 | UBE2E1 | 4230064 1090440 | 16865 | -0.209 | -0.6292 | Yes | ||
| 55 | PSMD4 | 430068 | 16899 | -0.215 | -0.6210 | Yes | ||
| 56 | ORC5L | 1940133 1940711 | 17097 | -0.252 | -0.6199 | Yes | ||
| 57 | PSME1 | 450193 4480035 | 17491 | -0.353 | -0.6247 | Yes | ||
| 58 | RPA3 | 5700136 | 17503 | -0.356 | -0.6087 | Yes | ||
| 59 | PSMD12 | 730044 | 17531 | -0.365 | -0.5932 | Yes | ||
| 60 | PSMA2 | 6510093 | 17678 | -0.420 | -0.5815 | Yes | ||
| 61 | RPA1 | 360452 | 17708 | -0.427 | -0.5632 | Yes | ||
| 62 | PSMB2 | 940035 4210324 | 18031 | -0.572 | -0.5540 | Yes | ||
| 63 | MAD2L1 | 4480725 | 18047 | -0.583 | -0.5277 | Yes | ||
| 64 | PSMA4 | 4560427 | 18051 | -0.585 | -0.5006 | Yes | ||
| 65 | PSMD7 | 2030619 6220594 | 18080 | -0.604 | -0.4740 | Yes | ||
| 66 | PSMD14 | 5690593 | 18127 | -0.630 | -0.4472 | Yes | ||
| 67 | PSMD10 | 520494 1170576 3830050 | 18182 | -0.660 | -0.4194 | Yes | ||
| 68 | CDC45L | 70537 3130114 | 18193 | -0.667 | -0.3889 | Yes | ||
| 69 | BUB1B | 1450288 | 18215 | -0.685 | -0.3582 | Yes | ||
| 70 | CCNB1 | 4590433 4780372 | 18216 | -0.685 | -0.3263 | Yes | ||
| 71 | MCM6 | 60092 540181 6510110 | 18453 | -0.990 | -0.2930 | Yes | ||
| 72 | PSMC4 | 580050 1580025 | 18506 | -1.133 | -0.2431 | Yes | ||
| 73 | MCM4 | 2760673 5420711 | 18538 | -1.324 | -0.1832 | Yes | ||
| 74 | RFC4 | 3800082 6840142 | 18540 | -1.338 | -0.1210 | Yes | ||
| 75 | CDC7 | 4060546 4850041 | 18609 | -2.689 | 0.0004 | Yes |

