Profile of the Running ES Score & Positions of GeneSet Members on the Rank Ordered List
| Dataset | Set_03_truncNotch_versus_wtNotch.phenotype_truncNotch_versus_wtNotch.cls #truncNotch_versus_wtNotch |
| Phenotype | phenotype_truncNotch_versus_wtNotch.cls#truncNotch_versus_wtNotch |
| Upregulated in class | wtNotch |
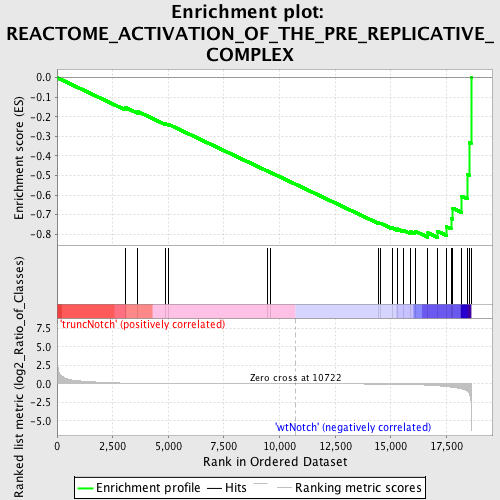
| GeneSet | REACTOME_ACTIVATION_OF_THE_PRE_REPLICATIVE_COMPLEX |
| Enrichment Score (ES) | -0.81637055 |
| Normalized Enrichment Score (NES) | -1.6260625 |
| Nominal p-value | 0.008948546 |
| FDR q-value | 0.4427422 |
| FWER p-Value | 0.716 |
| PROBE | DESCRIPTION (from dataset) | GENE SYMBOL | GENE_TITLE | RANK IN GENE LIST | RANK METRIC SCORE | RUNNING ES | CORE ENRICHMENT | |
|---|---|---|---|---|---|---|---|---|
| 1 | MCM2 | 5050139 | 3062 | 0.103 | -0.1518 | No | ||
| 2 | MCM5 | 2680647 | 3628 | 0.071 | -0.1733 | No | ||
| 3 | MCM3 | 5570068 | 4864 | 0.036 | -0.2352 | No | ||
| 4 | POLA2 | 940519 | 4991 | 0.034 | -0.2377 | No | ||
| 5 | POLE2 | 6110041 | 9439 | 0.004 | -0.4764 | No | ||
| 6 | POLA1 | 4760541 | 9613 | 0.003 | -0.4853 | No | ||
| 7 | MCM10 | 4920632 | 14437 | -0.023 | -0.7418 | No | ||
| 8 | ORC2L | 1990470 6510019 | 14531 | -0.025 | -0.7437 | No | ||
| 9 | ORC1L | 2370328 6110390 | 15055 | -0.039 | -0.7669 | No | ||
| 10 | CDK2 | 130484 2260301 4010088 5050110 | 15285 | -0.049 | -0.7730 | No | ||
| 11 | RPA2 | 2760301 5420195 | 15573 | -0.065 | -0.7803 | No | ||
| 12 | ORC4L | 4230538 5550288 | 15863 | -0.085 | -0.7851 | No | ||
| 13 | MCM7 | 3290292 5220056 | 16086 | -0.103 | -0.7841 | No | ||
| 14 | PRIM1 | 6420746 | 16667 | -0.175 | -0.7933 | Yes | ||
| 15 | ORC5L | 1940133 1940711 | 17097 | -0.252 | -0.7848 | Yes | ||
| 16 | RPA3 | 5700136 | 17503 | -0.356 | -0.7619 | Yes | ||
| 17 | RPA1 | 360452 | 17708 | -0.427 | -0.7193 | Yes | ||
| 18 | POLE | 6020538 | 17772 | -0.451 | -0.6662 | Yes | ||
| 19 | CDC45L | 70537 3130114 | 18193 | -0.667 | -0.6050 | Yes | ||
| 20 | MCM6 | 60092 540181 6510110 | 18453 | -0.990 | -0.4948 | Yes | ||
| 21 | MCM4 | 2760673 5420711 | 18538 | -1.324 | -0.3332 | Yes | ||
| 22 | CDC7 | 4060546 4850041 | 18609 | -2.689 | 0.0004 | Yes |

