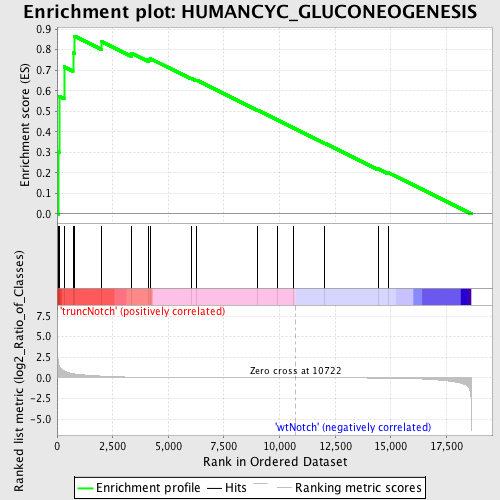
Profile of the Running ES Score & Positions of GeneSet Members on the Rank Ordered List
| Dataset | Set_03_truncNotch_versus_wtNotch.phenotype_truncNotch_versus_wtNotch.cls #truncNotch_versus_wtNotch |
| Phenotype | phenotype_truncNotch_versus_wtNotch.cls#truncNotch_versus_wtNotch |
| Upregulated in class | truncNotch |
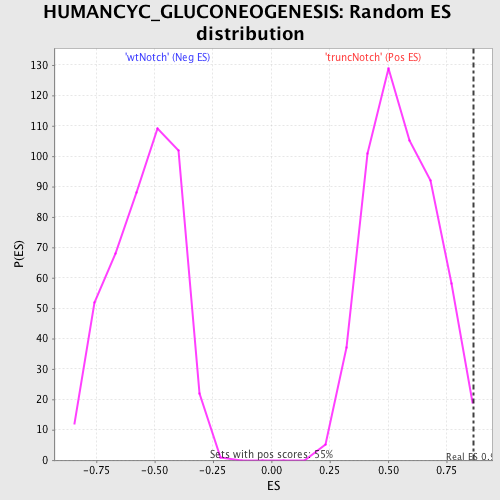
| GeneSet | HUMANCYC_GLUCONEOGENESIS |
| Enrichment Score (ES) | 0.86626375 |
| Normalized Enrichment Score (NES) | 1.5511873 |
| Nominal p-value | 0.0073260074 |
| FDR q-value | 0.29518127 |
| FWER p-Value | 0.967 |
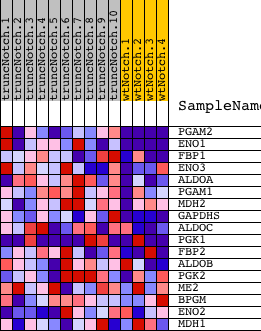
| PROBE | DESCRIPTION (from dataset) | GENE SYMBOL | GENE_TITLE | RANK IN GENE LIST | RANK METRIC SCORE | RUNNING ES | CORE ENRICHMENT | |
|---|---|---|---|---|---|---|---|---|
| 1 | PGAM2 | 3610605 | 62 | 1.709 | 0.3019 | Yes | ||
| 2 | ENO1 | 5340128 | 90 | 1.526 | 0.5730 | Yes | ||
| 3 | FBP1 | 1470762 | 313 | 0.870 | 0.7164 | Yes | ||
| 4 | ENO3 | 5270136 | 715 | 0.501 | 0.7843 | Yes | ||
| 5 | ALDOA | 6290672 | 779 | 0.478 | 0.8663 | Yes | ||
| 6 | PGAM1 | 2570133 | 1993 | 0.218 | 0.8399 | No | ||
| 7 | MDH2 | 1850601 | 3327 | 0.086 | 0.7836 | No | ||
| 8 | GAPDHS | 2690463 | 4118 | 0.054 | 0.7507 | No | ||
| 9 | ALDOC | 450121 610427 | 4188 | 0.052 | 0.7562 | No | ||
| 10 | PGK1 | 1570494 630300 | 6023 | 0.021 | 0.6613 | No | ||
| 11 | FBP2 | 1580193 | 6257 | 0.019 | 0.6521 | No | ||
| 12 | ALDOB | 4730324 | 9003 | 0.005 | 0.5054 | No | ||
| 13 | PGK2 | 2650091 | 9903 | 0.002 | 0.4574 | No | ||
| 14 | ME2 | 5080121 | 10606 | 0.000 | 0.4198 | No | ||
| 15 | BPGM | 5080520 | 12040 | -0.004 | 0.3434 | No | ||
| 16 | ENO2 | 2320068 | 14423 | -0.023 | 0.2194 | No | ||
| 17 | MDH1 | 6660358 6760731 | 14876 | -0.033 | 0.2011 | No |