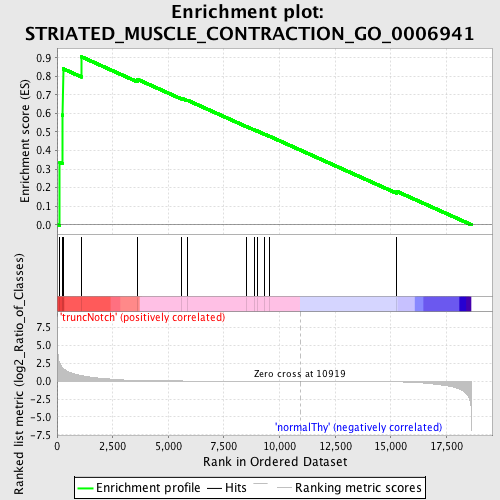
Profile of the Running ES Score & Positions of GeneSet Members on the Rank Ordered List
| Dataset | Set_03_truncNotch_versus_normalThy.phenotype_truncNotch_versus_normalThy.cls #truncNotch_versus_normalThy.phenotype_truncNotch_versus_normalThy.cls #truncNotch_versus_normalThy_repos |
| Phenotype | phenotype_truncNotch_versus_normalThy.cls#truncNotch_versus_normalThy_repos |
| Upregulated in class | truncNotch |
| GeneSet | STRIATED_MUSCLE_CONTRACTION_GO_0006941 |
| Enrichment Score (ES) | 0.9048262 |
| Normalized Enrichment Score (NES) | 1.5121938 |
| Nominal p-value | 0.0054744524 |
| FDR q-value | 0.3151162 |
| FWER p-Value | 0.994 |
| PROBE | DESCRIPTION (from dataset) | GENE SYMBOL | GENE_TITLE | RANK IN GENE LIST | RANK METRIC SCORE | RUNNING ES | CORE ENRICHMENT | |
|---|---|---|---|---|---|---|---|---|
| 1 | SRI | 3390446 4850064 | 123 | 2.450 | 0.3359 | Yes | ||
| 2 | ALDOA | 6290672 | 242 | 1.875 | 0.5917 | Yes | ||
| 3 | PGAM2 | 3610605 | 264 | 1.791 | 0.8409 | Yes | ||
| 4 | GAA | 520035 | 1100 | 0.778 | 0.9048 | Yes | ||
| 5 | DTNA | 1340600 1780731 2340278 2850132 | 3603 | 0.100 | 0.7843 | No | ||
| 6 | TTN | 2320161 4670056 6550026 | 5592 | 0.030 | 0.6816 | No | ||
| 7 | MYBPC3 | 650390 | 5855 | 0.026 | 0.6711 | No | ||
| 8 | MYBPH | 2190711 | 8534 | 0.007 | 0.5282 | No | ||
| 9 | MYL2 | 70471 | 8868 | 0.006 | 0.5111 | No | ||
| 10 | CASQ2 | 3170136 | 8986 | 0.006 | 0.5056 | No | ||
| 11 | SMPX | 6590440 | 9333 | 0.005 | 0.4876 | No | ||
| 12 | MYOM1 | 580091 | 9551 | 0.004 | 0.4765 | No | ||
| 13 | ATP2A1 | 110309 | 15270 | -0.077 | 0.1799 | No |

