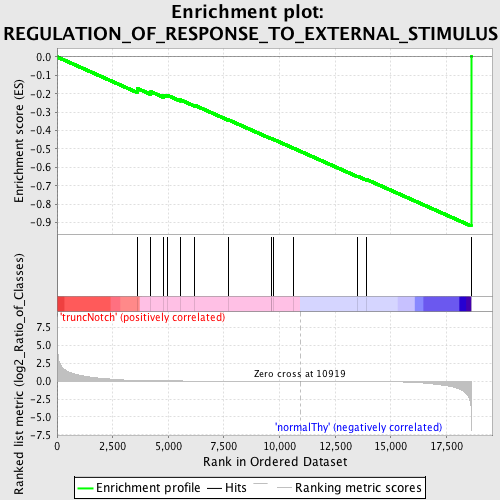
Profile of the Running ES Score & Positions of GeneSet Members on the Rank Ordered List
| Dataset | Set_03_truncNotch_versus_normalThy.phenotype_truncNotch_versus_normalThy.cls #truncNotch_versus_normalThy.phenotype_truncNotch_versus_normalThy.cls #truncNotch_versus_normalThy_repos |
| Phenotype | phenotype_truncNotch_versus_normalThy.cls#truncNotch_versus_normalThy_repos |
| Upregulated in class | normalThy |
| GeneSet | REGULATION_OF_RESPONSE_TO_EXTERNAL_STIMULUS |
| Enrichment Score (ES) | -0.9186583 |
| Normalized Enrichment Score (NES) | -1.5879688 |
| Nominal p-value | 0.0 |
| FDR q-value | 0.8469777 |
| FWER p-Value | 0.81 |
| PROBE | DESCRIPTION (from dataset) | GENE SYMBOL | GENE_TITLE | RANK IN GENE LIST | RANK METRIC SCORE | RUNNING ES | CORE ENRICHMENT | |
|---|---|---|---|---|---|---|---|---|
| 1 | SCG2 | 5670438 130671 | 3599 | 0.100 | -0.1709 | No | ||
| 2 | KLK8 | 60035 2340440 | 4215 | 0.066 | -0.1891 | No | ||
| 3 | CHRNA7 | 2970446 | 4779 | 0.047 | -0.2088 | No | ||
| 4 | AHSG | 6450014 | 4946 | 0.042 | -0.2081 | No | ||
| 5 | GHSR | 1980465 7050521 | 5535 | 0.031 | -0.2329 | No | ||
| 6 | CDH13 | 5130368 5340114 | 6175 | 0.022 | -0.2623 | No | ||
| 7 | CX3CL1 | 3990707 | 7694 | 0.011 | -0.3415 | No | ||
| 8 | IL20 | 4850647 | 9632 | 0.004 | -0.4448 | No | ||
| 9 | SLIT2 | 1940037 | 9639 | 0.004 | -0.4443 | No | ||
| 10 | NPY | 3170138 | 9711 | 0.003 | -0.4474 | No | ||
| 11 | LEP | 4010053 | 10635 | 0.001 | -0.4968 | No | ||
| 12 | CARTPT | 6660687 | 13495 | -0.012 | -0.6478 | No | ||
| 13 | GHRL | 2360619 6760438 | 13918 | -0.017 | -0.6665 | Yes | ||
| 14 | TNFRSF1A | 1090390 6520735 | 18609 | -4.080 | 0.0004 | Yes |

