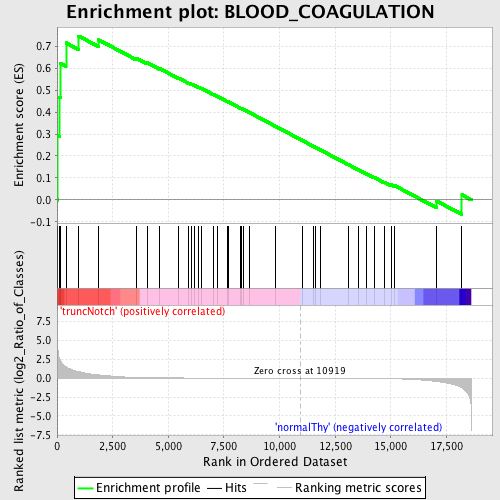
Profile of the Running ES Score & Positions of GeneSet Members on the Rank Ordered List
| Dataset | Set_03_truncNotch_versus_normalThy.phenotype_truncNotch_versus_normalThy.cls #truncNotch_versus_normalThy.phenotype_truncNotch_versus_normalThy.cls #truncNotch_versus_normalThy_repos |
| Phenotype | phenotype_truncNotch_versus_normalThy.cls#truncNotch_versus_normalThy_repos |
| Upregulated in class | truncNotch |
| GeneSet | BLOOD_COAGULATION |
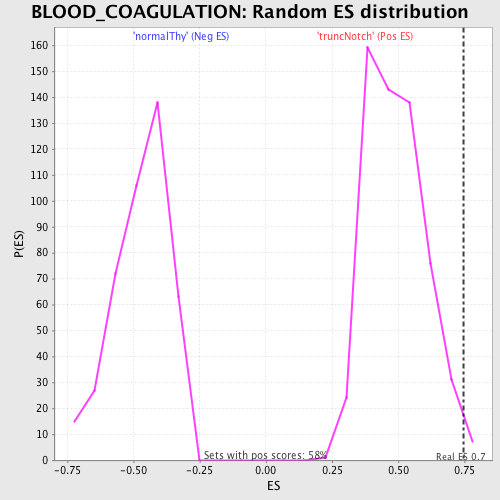
| Enrichment Score (ES) | 0.74711794 |
| Normalized Enrichment Score (NES) | 1.5241723 |
| Nominal p-value | 0.010362694 |
| FDR q-value | 0.41731766 |
| FWER p-Value | 0.983 |
| PROBE | DESCRIPTION (from dataset) | GENE SYMBOL | GENE_TITLE | RANK IN GENE LIST | RANK METRIC SCORE | RUNNING ES | CORE ENRICHMENT | |
|---|---|---|---|---|---|---|---|---|
| 1 | PABPC4 | 1990170 6760270 5390138 | 29 | 4.133 | 0.2929 | Yes | ||
| 2 | F2 | 5720280 | 113 | 2.509 | 0.4673 | Yes | ||
| 3 | F2RL3 | 5340010 | 159 | 2.219 | 0.6230 | Yes | ||
| 4 | PF4 | 6130332 | 400 | 1.488 | 0.7162 | Yes | ||
| 5 | F10 | 3830450 | 972 | 0.866 | 0.7471 | Yes | ||
| 6 | GNA12 | 1230301 | 1871 | 0.435 | 0.7298 | No | ||
| 7 | GGCX | 770377 3990441 | 3555 | 0.104 | 0.6467 | No | ||
| 8 | F7 | 5080411 | 4044 | 0.074 | 0.6257 | No | ||
| 9 | SERPINE1 | 4210403 | 4584 | 0.053 | 0.6004 | No | ||
| 10 | ADORA2A | 1990687 | 5457 | 0.032 | 0.5558 | No | ||
| 11 | HNF4A | 6620440 | 5926 | 0.025 | 0.5324 | No | ||
| 12 | F2RL2 | 6110736 | 6030 | 0.023 | 0.5285 | No | ||
| 13 | PLG | 3360270 3840100 | 6196 | 0.021 | 0.5211 | No | ||
| 14 | MMRN1 | 7050278 | 6351 | 0.020 | 0.5142 | No | ||
| 15 | PLAT | 6860128 | 6469 | 0.019 | 0.5093 | No | ||
| 16 | KNG1 | 6400576 6770347 | 7036 | 0.014 | 0.4798 | No | ||
| 17 | PROC | 6520270 | 7230 | 0.013 | 0.4704 | No | ||
| 18 | THBD | 1500092 | 7642 | 0.011 | 0.4490 | No | ||
| 19 | GP9 | 1190181 | 7692 | 0.011 | 0.4472 | No | ||
| 20 | F12 | 1090215 3520736 | 8264 | 0.008 | 0.4170 | No | ||
| 21 | ENTPD1 | 7050139 | 8303 | 0.008 | 0.4155 | No | ||
| 22 | F9 | 3190154 | 8377 | 0.008 | 0.4122 | No | ||
| 23 | TMPRSS6 | 3990095 7050022 | 8643 | 0.007 | 0.3984 | No | ||
| 24 | F8 | 2190647 2340465 | 9821 | 0.003 | 0.3352 | No | ||
| 25 | CD36 | 5890575 | 11024 | -0.000 | 0.2706 | No | ||
| 26 | F5 | 1990619 | 11543 | -0.002 | 0.2428 | No | ||
| 27 | F13B | 6220278 | 11629 | -0.002 | 0.2384 | No | ||
| 28 | CD40LG | 3120270 | 11850 | -0.003 | 0.2268 | No | ||
| 29 | GNAQ | 430670 4210131 5900736 | 13080 | -0.009 | 0.1612 | No | ||
| 30 | VWF | 4670519 | 13525 | -0.012 | 0.1382 | No | ||
| 31 | GP1BA | 6590372 | 13915 | -0.017 | 0.1185 | No | ||
| 32 | ITGB3 | 5270463 | 14252 | -0.024 | 0.1021 | No | ||
| 33 | TFPI | 1400288 5550008 | 14717 | -0.042 | 0.0801 | No | ||
| 34 | PROS1 | 5420465 | 15010 | -0.058 | 0.0686 | No | ||
| 35 | LMAN1 | 3420068 | 15178 | -0.070 | 0.0645 | No | ||
| 36 | WAS | 5270193 | 17059 | -0.434 | -0.0057 | No | ||
| 37 | F2R | 4810180 | 18198 | -1.255 | 0.0225 | No |