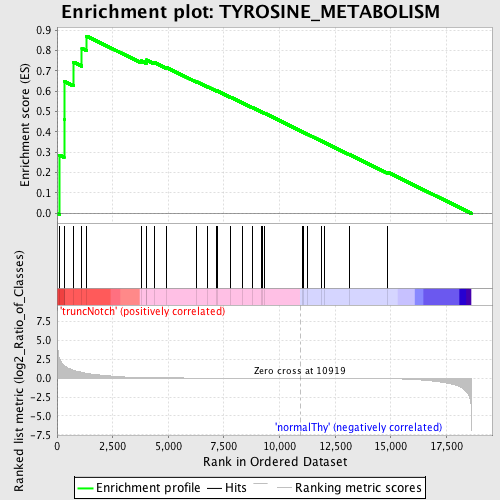
Profile of the Running ES Score & Positions of GeneSet Members on the Rank Ordered List
| Dataset | Set_03_truncNotch_versus_normalThy.phenotype_truncNotch_versus_normalThy.cls #truncNotch_versus_normalThy.phenotype_truncNotch_versus_normalThy.cls #truncNotch_versus_normalThy_repos |
| Phenotype | phenotype_truncNotch_versus_normalThy.cls#truncNotch_versus_normalThy_repos |
| Upregulated in class | truncNotch |
| GeneSet | TYROSINE_METABOLISM |
| Enrichment Score (ES) | 0.8709634 |
| Normalized Enrichment Score (NES) | 1.6382351 |
| Nominal p-value | 0.0016891892 |
| FDR q-value | 0.039907806 |
| FWER p-Value | 0.366 |
| PROBE | DESCRIPTION (from dataset) | GENE SYMBOL | GENE_TITLE | RANK IN GENE LIST | RANK METRIC SCORE | RUNNING ES | CORE ENRICHMENT | |
|---|---|---|---|---|---|---|---|---|
| 1 | COMT | 360687 510577 5700092 | 104 | 2.579 | 0.2860 | Yes | ||
| 2 | DDC | 670408 | 313 | 1.670 | 0.4637 | Yes | ||
| 3 | GSTZ1 | 7000451 | 323 | 1.641 | 0.6487 | Yes | ||
| 4 | GOT2 | 4570164 5220450 | 742 | 1.035 | 0.7433 | Yes | ||
| 5 | GOT1 | 2940465 | 1116 | 0.771 | 0.8104 | Yes | ||
| 6 | ALDH3B1 | 4210010 6940403 | 1331 | 0.638 | 0.8710 | Yes | ||
| 7 | ALDH3A1 | 580095 | 3780 | 0.088 | 0.7493 | No | ||
| 8 | ADH1A | 3170427 | 4012 | 0.076 | 0.7454 | No | ||
| 9 | FAH | 5390195 | 4016 | 0.076 | 0.7538 | No | ||
| 10 | MAOB | 2970520 3060056 | 4381 | 0.059 | 0.7409 | No | ||
| 11 | HPD | 3120519 | 4919 | 0.043 | 0.7168 | No | ||
| 12 | ADHFE1 | 1990673 6840022 | 6257 | 0.021 | 0.6473 | No | ||
| 13 | AOC3 | 6840129 | 6754 | 0.016 | 0.6224 | No | ||
| 14 | MAOA | 1410039 4610324 | 7153 | 0.014 | 0.6026 | No | ||
| 15 | HGD | 460390 | 7188 | 0.013 | 0.6022 | No | ||
| 16 | ALDH1A3 | 2100270 | 7785 | 0.010 | 0.5713 | No | ||
| 17 | PNMT | 4210563 | 8349 | 0.008 | 0.5419 | No | ||
| 18 | TH | 2100056 | 8781 | 0.006 | 0.5194 | No | ||
| 19 | ABP1 | 1980609 60056 | 9187 | 0.005 | 0.4982 | No | ||
| 20 | DBH | 3610458 | 9242 | 0.005 | 0.4958 | No | ||
| 21 | TAT | 7000427 | 9308 | 0.005 | 0.4929 | No | ||
| 22 | AOX1 | 110082 6290450 | 11009 | -0.000 | 0.4014 | No | ||
| 23 | TPO | 770609 | 11085 | -0.000 | 0.3975 | No | ||
| 24 | ADH4 | 6840301 | 11251 | -0.001 | 0.3887 | No | ||
| 25 | ADH7 | 60465 | 11872 | -0.003 | 0.3557 | No | ||
| 26 | TYR | 5690139 | 12000 | -0.003 | 0.3492 | No | ||
| 27 | DCT | 1090347 3840494 | 13141 | -0.009 | 0.2889 | No | ||
| 28 | AOC2 | 520348 3120008 | 14843 | -0.049 | 0.2030 | No |

