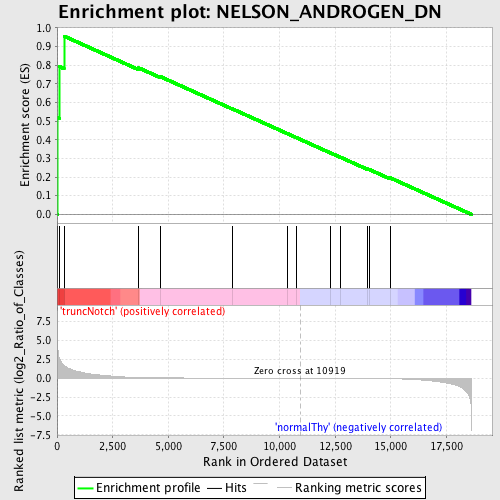
Profile of the Running ES Score & Positions of GeneSet Members on the Rank Ordered List
| Dataset | Set_03_truncNotch_versus_normalThy.phenotype_truncNotch_versus_normalThy.cls #truncNotch_versus_normalThy.phenotype_truncNotch_versus_normalThy.cls #truncNotch_versus_normalThy_repos |
| Phenotype | phenotype_truncNotch_versus_normalThy.cls#truncNotch_versus_normalThy_repos |
| Upregulated in class | truncNotch |
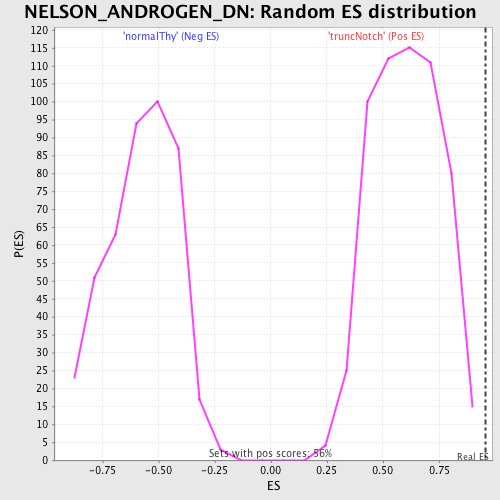
| GeneSet | NELSON_ANDROGEN_DN |
| Enrichment Score (ES) | 0.9559958 |
| Normalized Enrichment Score (NES) | 1.5872986 |
| Nominal p-value | 0.0 |
| FDR q-value | 0.10088174 |
| FWER p-Value | 0.798 |
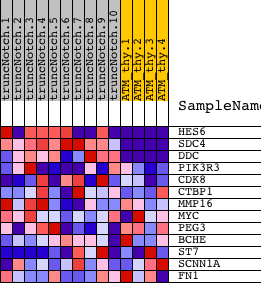
| PROBE | DESCRIPTION (from dataset) | GENE SYMBOL | GENE_TITLE | RANK IN GENE LIST | RANK METRIC SCORE | RUNNING ES | CORE ENRICHMENT | |
|---|---|---|---|---|---|---|---|---|
| 1 | HES6 | 540411 6550504 | 13 | 4.961 | 0.5174 | Yes | ||
| 2 | SDC4 | 6370411 | 94 | 2.683 | 0.7933 | Yes | ||
| 3 | DDC | 670408 | 313 | 1.670 | 0.9560 | Yes | ||
| 4 | PIK3R3 | 1770333 | 3672 | 0.095 | 0.7854 | No | ||
| 5 | CDK8 | 1050113 1190601 1780358 6110102 | 4646 | 0.051 | 0.7384 | No | ||
| 6 | CTBP1 | 3780315 | 7886 | 0.010 | 0.5653 | No | ||
| 7 | MMP16 | 2680139 | 10370 | 0.002 | 0.4320 | No | ||
| 8 | MYC | 380541 4670170 | 10764 | 0.000 | 0.4110 | No | ||
| 9 | PEG3 | 3710020 | 12290 | -0.005 | 0.3295 | No | ||
| 10 | BCHE | 2190685 | 12734 | -0.007 | 0.3063 | No | ||
| 11 | ST7 | 60600 610373 | 13934 | -0.018 | 0.2437 | No | ||
| 12 | SCNN1A | 4730019 | 14038 | -0.019 | 0.2402 | No | ||
| 13 | FN1 | 1170601 2970647 6220288 6940037 | 14972 | -0.055 | 0.1959 | No |