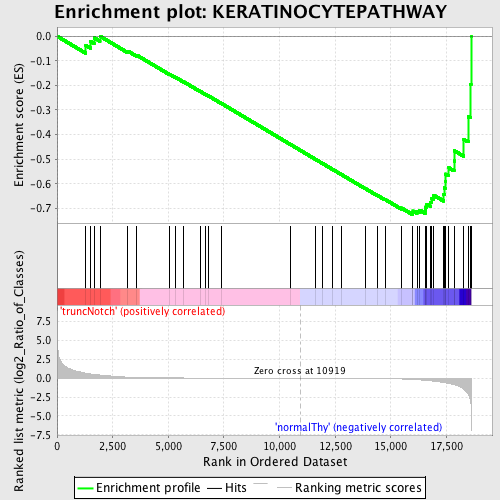
Profile of the Running ES Score & Positions of GeneSet Members on the Rank Ordered List
| Dataset | Set_03_truncNotch_versus_normalThy.phenotype_truncNotch_versus_normalThy.cls #truncNotch_versus_normalThy.phenotype_truncNotch_versus_normalThy.cls #truncNotch_versus_normalThy_repos |
| Phenotype | phenotype_truncNotch_versus_normalThy.cls#truncNotch_versus_normalThy_repos |
| Upregulated in class | normalThy |
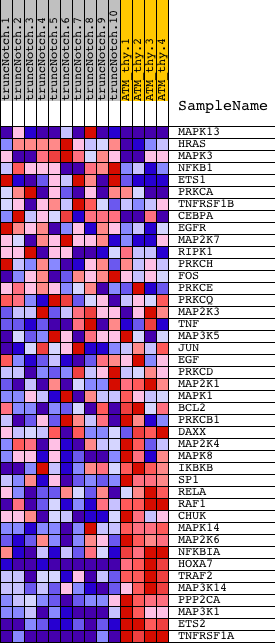
| GeneSet | KERATINOCYTEPATHWAY |
| Enrichment Score (ES) | -0.72511256 |
| Normalized Enrichment Score (NES) | -1.5881157 |
| Nominal p-value | 0.0024937657 |
| FDR q-value | 0.46736208 |
| FWER p-Value | 0.929 |
| PROBE | DESCRIPTION (from dataset) | GENE SYMBOL | GENE_TITLE | RANK IN GENE LIST | RANK METRIC SCORE | RUNNING ES | CORE ENRICHMENT | |
|---|---|---|---|---|---|---|---|---|
| 1 | MAPK13 | 6760215 | 1290 | 0.661 | -0.0374 | No | ||
| 2 | HRAS | 1980551 | 1508 | 0.558 | -0.0221 | No | ||
| 3 | MAPK3 | 580161 4780035 | 1667 | 0.499 | -0.0064 | No | ||
| 4 | NFKB1 | 5420358 | 1928 | 0.422 | -0.0000 | No | ||
| 5 | ETS1 | 5270278 6450717 6620465 | 3175 | 0.142 | -0.0602 | No | ||
| 6 | PRKCA | 6400551 | 3576 | 0.103 | -0.0768 | No | ||
| 7 | TNFRSF1B | 3990035 5860372 | 5055 | 0.040 | -0.1544 | No | ||
| 8 | CEBPA | 5690519 | 5330 | 0.035 | -0.1675 | No | ||
| 9 | EGFR | 4920138 6480521 | 5695 | 0.028 | -0.1857 | No | ||
| 10 | MAP2K7 | 2260086 | 6457 | 0.019 | -0.2258 | No | ||
| 11 | RIPK1 | 3190025 | 6667 | 0.017 | -0.2362 | No | ||
| 12 | PRKCH | 5720079 | 6807 | 0.016 | -0.2429 | No | ||
| 13 | FOS | 1850315 | 7390 | 0.012 | -0.2737 | No | ||
| 14 | PRKCE | 5700053 | 10501 | 0.001 | -0.4410 | No | ||
| 15 | PRKCQ | 2260170 3870193 | 11610 | -0.002 | -0.5006 | No | ||
| 16 | MAP2K3 | 5570193 | 11950 | -0.003 | -0.5187 | No | ||
| 17 | TNF | 6650603 | 12391 | -0.005 | -0.5421 | No | ||
| 18 | MAP3K5 | 6020041 6380162 | 12783 | -0.007 | -0.5628 | No | ||
| 19 | JUN | 840170 | 13846 | -0.016 | -0.6192 | No | ||
| 20 | EGF | 5220154 | 14388 | -0.028 | -0.6470 | No | ||
| 21 | PRKCD | 770592 | 14741 | -0.043 | -0.6639 | No | ||
| 22 | MAP2K1 | 840739 | 15475 | -0.098 | -0.6986 | No | ||
| 23 | MAPK1 | 3190193 6200253 | 15968 | -0.160 | -0.7174 | Yes | ||
| 24 | BCL2 | 730132 1570736 2470138 3800044 4810037 5690068 5860504 6650164 | 15995 | -0.163 | -0.7109 | Yes | ||
| 25 | PRKCB1 | 870019 3130092 | 16179 | -0.192 | -0.7114 | Yes | ||
| 26 | DAXX | 4010647 | 16292 | -0.214 | -0.7071 | Yes | ||
| 27 | MAP2K4 | 5130133 | 16544 | -0.277 | -0.7072 | Yes | ||
| 28 | MAPK8 | 2640195 | 16564 | -0.281 | -0.6946 | Yes | ||
| 29 | IKBKB | 6840072 | 16617 | -0.298 | -0.6830 | Yes | ||
| 30 | SP1 | 6590017 | 16789 | -0.347 | -0.6754 | Yes | ||
| 31 | RELA | 3830075 | 16834 | -0.358 | -0.6605 | Yes | ||
| 32 | RAF1 | 1770600 | 16929 | -0.388 | -0.6467 | Yes | ||
| 33 | CHUK | 7050736 | 17374 | -0.567 | -0.6432 | Yes | ||
| 34 | MAPK14 | 5290731 | 17410 | -0.583 | -0.6168 | Yes | ||
| 35 | MAP2K6 | 1230056 2940204 | 17445 | -0.603 | -0.5895 | Yes | ||
| 36 | NFKBIA | 1570152 | 17455 | -0.610 | -0.5604 | Yes | ||
| 37 | HOXA7 | 5910152 | 17605 | -0.687 | -0.5352 | Yes | ||
| 38 | TRAF2 | 5900148 | 17846 | -0.847 | -0.5071 | Yes | ||
| 39 | MAP3K14 | 5890435 | 17867 | -0.866 | -0.4662 | Yes | ||
| 40 | PPP2CA | 3990113 | 18280 | -1.429 | -0.4193 | Yes | ||
| 41 | MAP3K1 | 5360347 | 18485 | -2.116 | -0.3278 | Yes | ||
| 42 | ETS2 | 360451 | 18573 | -2.835 | -0.1953 | Yes | ||
| 43 | TNFRSF1A | 1090390 6520735 | 18609 | -4.080 | 0.0004 | Yes |