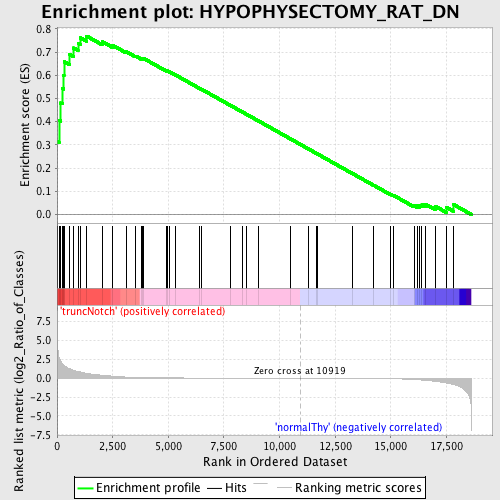
Profile of the Running ES Score & Positions of GeneSet Members on the Rank Ordered List
| Dataset | Set_03_truncNotch_versus_normalThy.phenotype_truncNotch_versus_normalThy.cls #truncNotch_versus_normalThy.phenotype_truncNotch_versus_normalThy.cls #truncNotch_versus_normalThy_repos |
| Phenotype | phenotype_truncNotch_versus_normalThy.cls#truncNotch_versus_normalThy_repos |
| Upregulated in class | truncNotch |
| GeneSet | HYPOPHYSECTOMY_RAT_DN |
| Enrichment Score (ES) | 0.7684256 |
| Normalized Enrichment Score (NES) | 1.5832268 |
| Nominal p-value | 0.0051635113 |
| FDR q-value | 0.09779758 |
| FWER p-Value | 0.828 |
| PROBE | DESCRIPTION (from dataset) | GENE SYMBOL | GENE_TITLE | RANK IN GENE LIST | RANK METRIC SCORE | RUNNING ES | CORE ENRICHMENT | |
|---|---|---|---|---|---|---|---|---|
| 1 | TKT | 6590064 6860039 | 0 | 8.890 | 0.3152 | Yes | ||
| 2 | ACAA2 | 1570347 2360324 6130139 | 91 | 2.687 | 0.4056 | Yes | ||
| 3 | ENO1 | 5340128 | 161 | 2.215 | 0.4804 | Yes | ||
| 4 | FBP1 | 1470762 | 240 | 1.886 | 0.5431 | Yes | ||
| 5 | PDIA3 | 2120270 | 296 | 1.700 | 0.6004 | Yes | ||
| 6 | DDC | 670408 | 313 | 1.670 | 0.6588 | Yes | ||
| 7 | MGP | 6900736 | 566 | 1.252 | 0.6896 | Yes | ||
| 8 | PADI4 | 1740075 4810441 | 737 | 1.041 | 0.7174 | Yes | ||
| 9 | LDHA | 2190594 | 944 | 0.881 | 0.7375 | Yes | ||
| 10 | SCD | 2680441 | 1049 | 0.816 | 0.7608 | Yes | ||
| 11 | PSMB8 | 2850707 | 1329 | 0.638 | 0.7684 | Yes | ||
| 12 | LIMS2 | 5130204 6130129 | 2025 | 0.388 | 0.7448 | No | ||
| 13 | TFF3 | 1580129 | 2494 | 0.265 | 0.7290 | No | ||
| 14 | DCN | 510332 5340026 5900711 6550092 | 3104 | 0.151 | 0.7016 | No | ||
| 15 | FDPS | 60022 | 3525 | 0.107 | 0.6827 | No | ||
| 16 | ALAS1 | 6400440 | 3808 | 0.087 | 0.6706 | No | ||
| 17 | HADH | 1690341 3830465 | 3847 | 0.085 | 0.6716 | No | ||
| 18 | COL3A1 | 6420273 6620044 | 3864 | 0.083 | 0.6737 | No | ||
| 19 | NPPA | 6550328 | 4931 | 0.043 | 0.6178 | No | ||
| 20 | AHSG | 6450014 | 4946 | 0.042 | 0.6185 | No | ||
| 21 | DECR1 | 6590390 | 5049 | 0.040 | 0.6145 | No | ||
| 22 | AQP8 | 6770402 | 5322 | 0.035 | 0.6011 | No | ||
| 23 | FBLN5 | 6550010 | 6395 | 0.019 | 0.5440 | No | ||
| 24 | MEP1B | 1240341 5270168 | 6485 | 0.019 | 0.5399 | No | ||
| 25 | ODC1 | 5670168 | 7808 | 0.010 | 0.4691 | No | ||
| 26 | PDK4 | 6400300 | 8339 | 0.008 | 0.4408 | No | ||
| 27 | PIM3 | 3360138 | 8515 | 0.007 | 0.4317 | No | ||
| 28 | CALR | 510446 | 9059 | 0.005 | 0.4026 | No | ||
| 29 | B2M | 5080332 5130059 | 10512 | 0.001 | 0.3245 | No | ||
| 30 | OAT | 540632 | 11320 | -0.001 | 0.2811 | No | ||
| 31 | SPARC | 1690086 | 11661 | -0.002 | 0.2628 | No | ||
| 32 | ALDOB | 4730324 | 11700 | -0.002 | 0.2609 | No | ||
| 33 | RAB3B | 110068 | 13290 | -0.010 | 0.1757 | No | ||
| 34 | ARF4 | 3190661 | 14224 | -0.023 | 0.1263 | No | ||
| 35 | FN1 | 1170601 2970647 6220288 6940037 | 14972 | -0.055 | 0.0880 | No | ||
| 36 | ACSL1 | 2900520 | 15111 | -0.065 | 0.0829 | No | ||
| 37 | FTH1 | 3830154 | 16047 | -0.170 | 0.0386 | No | ||
| 38 | PEX19 | 3140037 | 16193 | -0.195 | 0.0377 | No | ||
| 39 | DAD1 | 430239 | 16304 | -0.217 | 0.0395 | No | ||
| 40 | GLUD1 | 4210372 | 16400 | -0.236 | 0.0427 | No | ||
| 41 | SLC9A1 | 2650093 | 16566 | -0.281 | 0.0438 | No | ||
| 42 | ECH1 | 4120746 | 17017 | -0.420 | 0.0345 | No | ||
| 43 | ATP2A2 | 1090075 3990279 | 17491 | -0.626 | 0.0312 | No | ||
| 44 | IDH1 | 1990021 | 17822 | -0.827 | 0.0428 | No |

