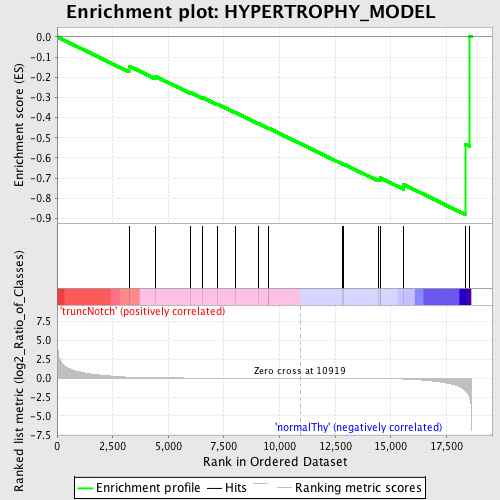
Profile of the Running ES Score & Positions of GeneSet Members on the Rank Ordered List
| Dataset | Set_03_truncNotch_versus_normalThy.phenotype_truncNotch_versus_normalThy.cls #truncNotch_versus_normalThy.phenotype_truncNotch_versus_normalThy.cls #truncNotch_versus_normalThy_repos |
| Phenotype | phenotype_truncNotch_versus_normalThy.cls#truncNotch_versus_normalThy_repos |
| Upregulated in class | normalThy |
| GeneSet | HYPERTROPHY_MODEL |
| Enrichment Score (ES) | -0.88004655 |
| Normalized Enrichment Score (NES) | -1.5970298 |
| Nominal p-value | 0.0023419203 |
| FDR q-value | 0.48899883 |
| FWER p-Value | 0.896 |
| PROBE | DESCRIPTION (from dataset) | GENE SYMBOL | GENE_TITLE | RANK IN GENE LIST | RANK METRIC SCORE | RUNNING ES | CORE ENRICHMENT | |
|---|---|---|---|---|---|---|---|---|
| 1 | DUSP14 | 1230358 | 3232 | 0.135 | -0.1446 | No | ||
| 2 | IL1R1 | 3850377 6180128 | 4407 | 0.058 | -0.1952 | No | ||
| 3 | ATF3 | 1940546 | 6016 | 0.023 | -0.2767 | No | ||
| 4 | MYOG | 3190672 | 6547 | 0.018 | -0.3012 | No | ||
| 5 | HBEGF | 2030156 | 7190 | 0.013 | -0.3329 | No | ||
| 6 | IL1A | 3610056 | 8005 | 0.009 | -0.3746 | No | ||
| 7 | ANKRD1 | 4850685 | 9057 | 0.005 | -0.4300 | No | ||
| 8 | IL18 | 6180039 | 9510 | 0.004 | -0.4534 | No | ||
| 9 | ADAM10 | 3780156 | 9517 | 0.004 | -0.4529 | No | ||
| 10 | GDF8 | 3850504 | 12813 | -0.007 | -0.6285 | No | ||
| 11 | IFNG | 5670592 | 12891 | -0.007 | -0.6310 | No | ||
| 12 | NR4A3 | 2900021 5860095 5910039 | 14428 | -0.029 | -0.7074 | No | ||
| 13 | IFRD1 | 4590215 | 14518 | -0.032 | -0.7052 | No | ||
| 14 | CYR61 | 1240408 5290026 4120452 6550008 | 14530 | -0.033 | -0.6987 | No | ||
| 15 | EIF4E | 1580403 70133 6380215 | 15566 | -0.108 | -0.7310 | Yes | ||
| 16 | WDR1 | 1090129 3990121 | 18339 | -1.617 | -0.5311 | Yes | ||
| 17 | EIF4EBP1 | 60132 5720148 | 18548 | -2.530 | 0.0037 | Yes |

