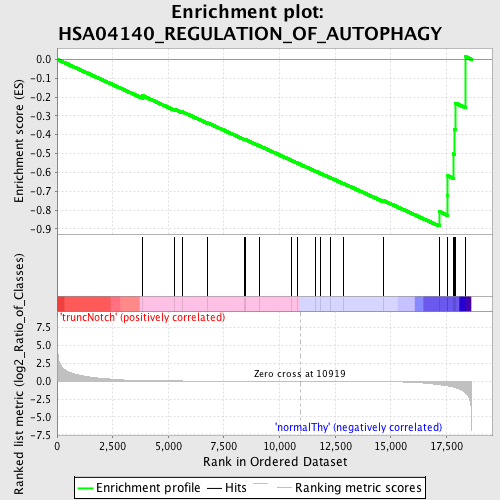
Profile of the Running ES Score & Positions of GeneSet Members on the Rank Ordered List
| Dataset | Set_03_truncNotch_versus_normalThy.phenotype_truncNotch_versus_normalThy.cls #truncNotch_versus_normalThy.phenotype_truncNotch_versus_normalThy.cls #truncNotch_versus_normalThy_repos |
| Phenotype | phenotype_truncNotch_versus_normalThy.cls#truncNotch_versus_normalThy_repos |
| Upregulated in class | normalThy |
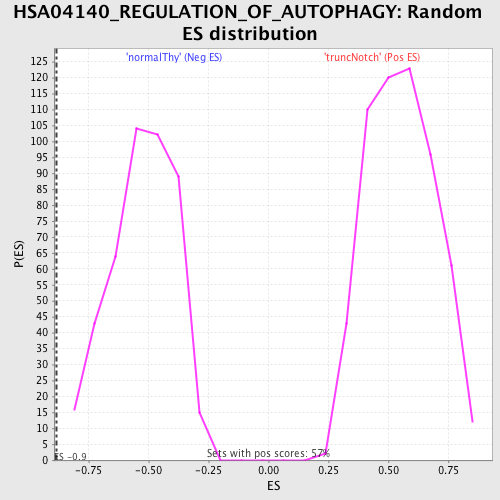
| GeneSet | HSA04140_REGULATION_OF_AUTOPHAGY |
| Enrichment Score (ES) | -0.8841399 |
| Normalized Enrichment Score (NES) | -1.6934702 |
| Nominal p-value | 0.0 |
| FDR q-value | 0.3290523 |
| FWER p-Value | 0.252 |
| PROBE | DESCRIPTION (from dataset) | GENE SYMBOL | GENE_TITLE | RANK IN GENE LIST | RANK METRIC SCORE | RUNNING ES | CORE ENRICHMENT | |
|---|---|---|---|---|---|---|---|---|
| 1 | ATG7 | 3940619 | 3828 | 0.086 | -0.1923 | No | ||
| 2 | PRKAA1 | 510156 | 5271 | 0.036 | -0.2642 | No | ||
| 3 | IFNA6 | 5550414 | 5630 | 0.029 | -0.2788 | No | ||
| 4 | IFNA14 | 4540142 | 6752 | 0.016 | -0.3365 | No | ||
| 5 | IFNA4 | 1940025 | 8420 | 0.008 | -0.4249 | No | ||
| 6 | IFNA1 | 5390592 | 8478 | 0.007 | -0.4269 | No | ||
| 7 | ATG5 | 6200433 5360324 | 9116 | 0.005 | -0.4603 | No | ||
| 8 | IFNA2 | 4150162 | 10548 | 0.001 | -0.5371 | No | ||
| 9 | IFNA7 | 2510239 | 10826 | 0.000 | -0.5519 | No | ||
| 10 | PIK3R4 | 1990132 | 11626 | -0.002 | -0.5946 | No | ||
| 11 | IFNA13 | 1980086 | 11832 | -0.003 | -0.6051 | No | ||
| 12 | ATG3 | 5550647 6350050 | 12277 | -0.004 | -0.6283 | No | ||
| 13 | IFNG | 5670592 | 12891 | -0.007 | -0.6601 | No | ||
| 14 | IFNA5 | 4780072 | 14667 | -0.039 | -0.7494 | No | ||
| 15 | ULK2 | 50041 5050176 | 17174 | -0.483 | -0.8078 | Yes | ||
| 16 | ULK1 | 6100315 | 17557 | -0.663 | -0.7235 | Yes | ||
| 17 | GABARAP | 1450286 | 17563 | -0.667 | -0.6182 | Yes | ||
| 18 | BECN1 | 3840433 | 17808 | -0.819 | -0.5018 | Yes | ||
| 19 | PIK3C3 | 6590717 | 17849 | -0.847 | -0.3699 | Yes | ||
| 20 | GABARAPL1 | 2810458 | 17894 | -0.887 | -0.2318 | Yes | ||
| 21 | ATG12 | 780167 | 18372 | -1.711 | 0.0131 | Yes |