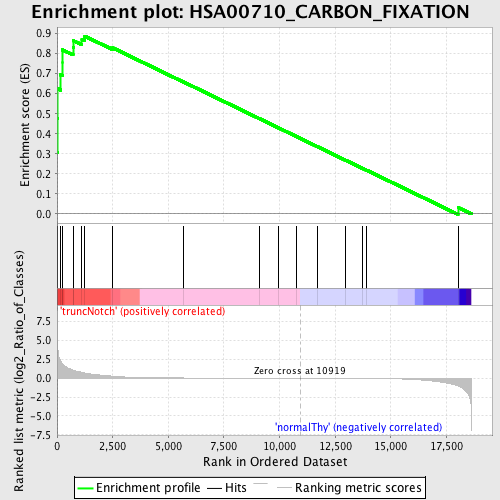
Profile of the Running ES Score & Positions of GeneSet Members on the Rank Ordered List
| Dataset | Set_03_truncNotch_versus_normalThy.phenotype_truncNotch_versus_normalThy.cls #truncNotch_versus_normalThy.phenotype_truncNotch_versus_normalThy.cls #truncNotch_versus_normalThy_repos |
| Phenotype | phenotype_truncNotch_versus_normalThy.cls#truncNotch_versus_normalThy_repos |
| Upregulated in class | truncNotch |
| GeneSet | HSA00710_CARBON_FIXATION |
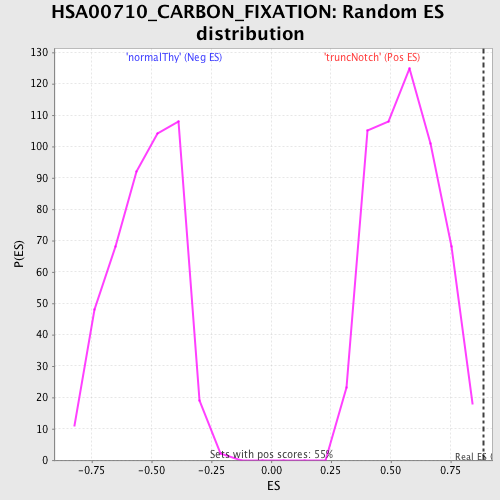
| Enrichment Score (ES) | 0.887244 |
| Normalized Enrichment Score (NES) | 1.5797747 |
| Nominal p-value | 0.0 |
| FDR q-value | 0.10028519 |
| FWER p-Value | 0.849 |
| PROBE | DESCRIPTION (from dataset) | GENE SYMBOL | GENE_TITLE | RANK IN GENE LIST | RANK METRIC SCORE | RUNNING ES | CORE ENRICHMENT | |
|---|---|---|---|---|---|---|---|---|
| 1 | TKT | 6590064 6860039 | 0 | 8.890 | 0.3056 | Yes | ||
| 2 | PGK1 | 1570494 630300 | 11 | 5.024 | 0.4778 | Yes | ||
| 3 | TPI1 | 1500215 2100154 | 25 | 4.295 | 0.6247 | Yes | ||
| 4 | PKM2 | 6520403 70500 | 160 | 2.217 | 0.6938 | Yes | ||
| 5 | FBP1 | 1470762 | 240 | 1.886 | 0.7543 | Yes | ||
| 6 | ALDOA | 6290672 | 242 | 1.875 | 0.8187 | Yes | ||
| 7 | GPT | 2350270 | 718 | 1.052 | 0.8294 | Yes | ||
| 8 | GOT2 | 4570164 5220450 | 742 | 1.035 | 0.8637 | Yes | ||
| 9 | GOT1 | 2940465 | 1116 | 0.771 | 0.8701 | Yes | ||
| 10 | MDH2 | 1850601 | 1242 | 0.693 | 0.8872 | Yes | ||
| 11 | GPT2 | 1850463 | 2505 | 0.263 | 0.8284 | No | ||
| 12 | FBP2 | 1580193 | 5674 | 0.029 | 0.6591 | No | ||
| 13 | TKTL1 | 2810672 6760102 | 9109 | 0.005 | 0.4746 | No | ||
| 14 | PKLR | 1170400 2470114 | 9933 | 0.003 | 0.4304 | No | ||
| 15 | RPE | 940114 | 10766 | 0.000 | 0.3857 | No | ||
| 16 | ALDOB | 4730324 | 11700 | -0.002 | 0.3356 | No | ||
| 17 | MDH1 | 6660358 6760731 | 12968 | -0.008 | 0.2678 | No | ||
| 18 | PGK2 | 2650091 | 13736 | -0.015 | 0.2270 | No | ||
| 19 | ALDOC | 450121 610427 | 13898 | -0.017 | 0.2190 | No | ||
| 20 | RPIA | 780079 | 18022 | -1.009 | 0.0319 | No |