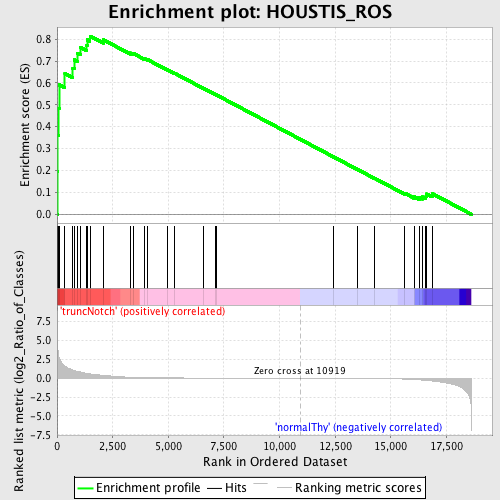
Profile of the Running ES Score & Positions of GeneSet Members on the Rank Ordered List
| Dataset | Set_03_truncNotch_versus_normalThy.phenotype_truncNotch_versus_normalThy.cls #truncNotch_versus_normalThy.phenotype_truncNotch_versus_normalThy.cls #truncNotch_versus_normalThy_repos |
| Phenotype | phenotype_truncNotch_versus_normalThy.cls#truncNotch_versus_normalThy_repos |
| Upregulated in class | truncNotch |
| GeneSet | HOUSTIS_ROS |
| Enrichment Score (ES) | 0.8137035 |
| Normalized Enrichment Score (NES) | 1.5776759 |
| Nominal p-value | 0.0016778524 |
| FDR q-value | 0.09967727 |
| FWER p-Value | 0.861 |
| PROBE | DESCRIPTION (from dataset) | GENE SYMBOL | GENE_TITLE | RANK IN GENE LIST | RANK METRIC SCORE | RUNNING ES | CORE ENRICHMENT | |
|---|---|---|---|---|---|---|---|---|
| 1 | PRDX2 | 6760095 4010619 5340577 | 19 | 4.767 | 0.1943 | Yes | ||
| 2 | MT1A | 4850164 | 30 | 4.039 | 0.3593 | Yes | ||
| 3 | HMOX1 | 1740687 | 64 | 3.070 | 0.4833 | Yes | ||
| 4 | SDC4 | 6370411 | 94 | 2.683 | 0.5917 | Yes | ||
| 5 | GPX3 | 1340450 | 350 | 1.592 | 0.6432 | Yes | ||
| 6 | HP | 2940551 6350068 | 706 | 1.059 | 0.6675 | Yes | ||
| 7 | SOD2 | 1410053 | 769 | 1.012 | 0.7057 | Yes | ||
| 8 | TXN2 | 2030402 | 907 | 0.908 | 0.7355 | Yes | ||
| 9 | PRDX4 | 3800039 | 1047 | 0.818 | 0.7615 | Yes | ||
| 10 | SOD1 | 5890070 | 1333 | 0.637 | 0.7723 | Yes | ||
| 11 | TXNRD2 | 2510398 3780451 | 1353 | 0.627 | 0.7970 | Yes | ||
| 12 | MT2A | 6860286 | 1478 | 0.572 | 0.8137 | Yes | ||
| 13 | GPX4 | 5080433 | 2072 | 0.376 | 0.7972 | No | ||
| 14 | HPXN | 3440114 | 3294 | 0.128 | 0.7367 | No | ||
| 15 | PRDX1 | 5720253 | 3446 | 0.114 | 0.7333 | No | ||
| 16 | GLRX2 | 940433 | 3941 | 0.079 | 0.7099 | No | ||
| 17 | PRDX3 | 1690035 | 4076 | 0.073 | 0.7057 | No | ||
| 18 | CYP1B1 | 4760735 | 4952 | 0.042 | 0.6603 | No | ||
| 19 | PRDX6 | 4920397 6380601 | 5286 | 0.035 | 0.6439 | No | ||
| 20 | SOD3 | 1410484 | 6585 | 0.018 | 0.5748 | No | ||
| 21 | GPX5 | 4200397 5690739 | 7123 | 0.014 | 0.5464 | No | ||
| 22 | CP | 2570484 | 7148 | 0.014 | 0.5457 | No | ||
| 23 | TXN1 | 1850181 2260041 | 12433 | -0.005 | 0.2616 | No | ||
| 24 | CAT | 4280152 | 13490 | -0.012 | 0.2053 | No | ||
| 25 | GPX1 | 4150093 | 14266 | -0.024 | 0.1646 | No | ||
| 26 | TXNRD1 | 6590446 | 15628 | -0.115 | 0.0960 | No | ||
| 27 | FTH1 | 3830154 | 16047 | -0.170 | 0.0805 | No | ||
| 28 | XDH | 6840446 | 16283 | -0.213 | 0.0766 | No | ||
| 29 | FTL1 | 5670594 | 16416 | -0.239 | 0.0793 | No | ||
| 30 | HMOX2 | 6100193 | 16578 | -0.285 | 0.0823 | No | ||
| 31 | GPX2 | 6940619 | 16612 | -0.297 | 0.0927 | No | ||
| 32 | GCLM | 4230270 | 16860 | -0.369 | 0.0945 | No |

