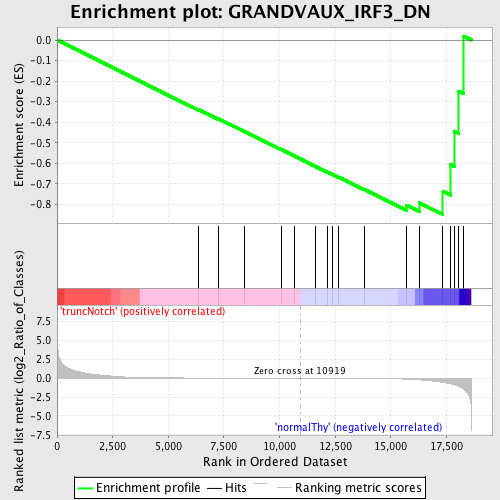
Profile of the Running ES Score & Positions of GeneSet Members on the Rank Ordered List
| Dataset | Set_03_truncNotch_versus_normalThy.phenotype_truncNotch_versus_normalThy.cls #truncNotch_versus_normalThy.phenotype_truncNotch_versus_normalThy.cls #truncNotch_versus_normalThy_repos |
| Phenotype | phenotype_truncNotch_versus_normalThy.cls#truncNotch_versus_normalThy_repos |
| Upregulated in class | normalThy |
| GeneSet | GRANDVAUX_IRF3_DN |
| Enrichment Score (ES) | -0.8489048 |
| Normalized Enrichment Score (NES) | -1.5506035 |
| Nominal p-value | 0.00896861 |
| FDR q-value | 0.2766452 |
| FWER p-Value | 0.987 |

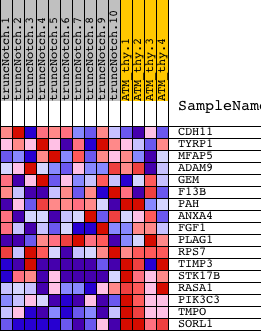
| PROBE | DESCRIPTION (from dataset) | GENE SYMBOL | GENE_TITLE | RANK IN GENE LIST | RANK METRIC SCORE | RUNNING ES | CORE ENRICHMENT | |
|---|---|---|---|---|---|---|---|---|
| 1 | CDH11 | 1230133 2100180 4610110 | 6354 | 0.020 | -0.3376 | No | ||
| 2 | TYRP1 | 3170450 5690204 6290092 | 7246 | 0.013 | -0.3829 | No | ||
| 3 | MFAP5 | 4920139 | 8418 | 0.008 | -0.4443 | No | ||
| 4 | ADAM9 | 3360411 | 10076 | 0.002 | -0.5329 | No | ||
| 5 | GEM | 5290082 | 10682 | 0.001 | -0.5653 | No | ||
| 6 | F13B | 6220278 | 11629 | -0.002 | -0.6157 | No | ||
| 7 | PAH | 3800309 | 12166 | -0.004 | -0.6437 | No | ||
| 8 | ANXA4 | 1400315 | 12365 | -0.005 | -0.6534 | No | ||
| 9 | FGF1 | 4780435 5670601 | 12638 | -0.006 | -0.6668 | No | ||
| 10 | PLAG1 | 1450142 3870139 6520039 | 13805 | -0.016 | -0.7263 | No | ||
| 11 | RPS7 | 6860113 | 15690 | -0.121 | -0.8031 | Yes | ||
| 12 | TIMP3 | 1450504 1980270 | 16285 | -0.213 | -0.7920 | Yes | ||
| 13 | STK17B | 130091 | 17344 | -0.555 | -0.7368 | Yes | ||
| 14 | RASA1 | 1240315 | 17696 | -0.741 | -0.6062 | Yes | ||
| 15 | PIK3C3 | 6590717 | 17849 | -0.847 | -0.4433 | Yes | ||
| 16 | TMPO | 4050494 | 18028 | -1.013 | -0.2484 | Yes | ||
| 17 | SORL1 | 630204 | 18263 | -1.387 | 0.0190 | Yes |

