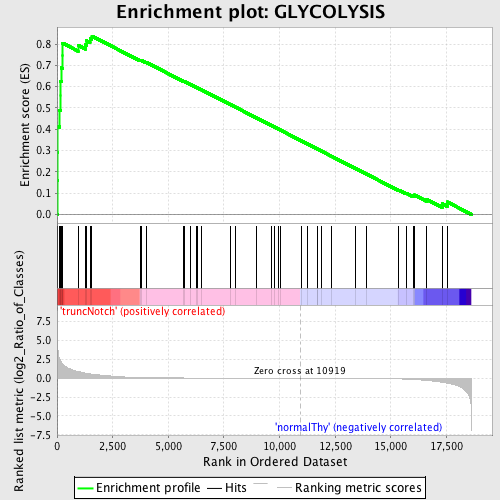
Profile of the Running ES Score & Positions of GeneSet Members on the Rank Ordered List
| Dataset | Set_03_truncNotch_versus_normalThy.phenotype_truncNotch_versus_normalThy.cls #truncNotch_versus_normalThy.phenotype_truncNotch_versus_normalThy.cls #truncNotch_versus_normalThy_repos |
| Phenotype | phenotype_truncNotch_versus_normalThy.cls#truncNotch_versus_normalThy_repos |
| Upregulated in class | truncNotch |
| GeneSet | GLYCOLYSIS |
| Enrichment Score (ES) | 0.83740705 |
| Normalized Enrichment Score (NES) | 1.7189589 |
| Nominal p-value | 0.0 |
| FDR q-value | 0.00943046 |
| FWER p-Value | 0.04 |
| PROBE | DESCRIPTION (from dataset) | GENE SYMBOL | GENE_TITLE | RANK IN GENE LIST | RANK METRIC SCORE | RUNNING ES | CORE ENRICHMENT | |
|---|---|---|---|---|---|---|---|---|
| 1 | PGK1 | 1570494 630300 | 11 | 5.024 | 0.1579 | Yes | ||
| 2 | TPI1 | 1500215 2100154 | 25 | 4.295 | 0.2926 | Yes | ||
| 3 | PFKM | 1990156 5720168 | 34 | 3.868 | 0.4142 | Yes | ||
| 4 | ALDH1B1 | 610195 | 114 | 2.502 | 0.4888 | Yes | ||
| 5 | PKM2 | 6520403 70500 | 160 | 2.217 | 0.5563 | Yes | ||
| 6 | ENO1 | 5340128 | 161 | 2.215 | 0.6262 | Yes | ||
| 7 | ENO3 | 5270136 | 198 | 2.033 | 0.6883 | Yes | ||
| 8 | FBP1 | 1470762 | 240 | 1.886 | 0.7456 | Yes | ||
| 9 | ALDOA | 6290672 | 242 | 1.875 | 0.8047 | Yes | ||
| 10 | LDHA | 2190594 | 944 | 0.881 | 0.7947 | Yes | ||
| 11 | HK2 | 2640722 | 1283 | 0.665 | 0.7975 | Yes | ||
| 12 | ALDH3B1 | 4210010 6940403 | 1331 | 0.638 | 0.8151 | Yes | ||
| 13 | PGAM1 | 2570133 | 1480 | 0.571 | 0.8251 | Yes | ||
| 14 | ALDH2 | 4230019 | 1567 | 0.537 | 0.8374 | Yes | ||
| 15 | G6PC | 430093 | 3730 | 0.091 | 0.7239 | No | ||
| 16 | ALDH3A1 | 580095 | 3780 | 0.088 | 0.7240 | No | ||
| 17 | ADH1A | 3170427 | 4012 | 0.076 | 0.7140 | No | ||
| 18 | FBP2 | 1580193 | 5674 | 0.029 | 0.6254 | No | ||
| 19 | HK1 | 4280402 | 5714 | 0.028 | 0.6242 | No | ||
| 20 | LDHC | 2030458 6100463 | 6007 | 0.023 | 0.6092 | No | ||
| 21 | ADHFE1 | 1990673 6840022 | 6257 | 0.021 | 0.5965 | No | ||
| 22 | DLD | 4150403 6590341 | 6307 | 0.020 | 0.5945 | No | ||
| 23 | GAPDH | 110022 430039 6220161 | 6478 | 0.019 | 0.5859 | No | ||
| 24 | ALDH1A3 | 2100270 | 7785 | 0.010 | 0.5159 | No | ||
| 25 | PGM1 | 3840408 | 8013 | 0.009 | 0.5040 | No | ||
| 26 | ACYP2 | 2510605 | 8967 | 0.006 | 0.4528 | No | ||
| 27 | ACYP1 | 6380403 | 9623 | 0.004 | 0.4177 | No | ||
| 28 | ALDH1A1 | 6520706 | 9777 | 0.003 | 0.4095 | No | ||
| 29 | PKLR | 1170400 2470114 | 9933 | 0.003 | 0.4013 | No | ||
| 30 | GCK | 2370273 | 10062 | 0.002 | 0.3945 | No | ||
| 31 | PDHA2 | 2630438 | 10970 | -0.000 | 0.3456 | No | ||
| 32 | ADH4 | 6840301 | 11251 | -0.001 | 0.3306 | No | ||
| 33 | ALDOB | 4730324 | 11700 | -0.002 | 0.3065 | No | ||
| 34 | PGM3 | 2570465 | 11717 | -0.002 | 0.3058 | No | ||
| 35 | ADH7 | 60465 | 11872 | -0.003 | 0.2976 | No | ||
| 36 | ALDH9A1 | 4810047 | 12348 | -0.005 | 0.2721 | No | ||
| 37 | ALDH1A2 | 2320301 | 13414 | -0.011 | 0.2152 | No | ||
| 38 | ALDOC | 450121 610427 | 13898 | -0.017 | 0.1897 | No | ||
| 39 | BPGM | 5080520 | 15363 | -0.087 | 0.1136 | No | ||
| 40 | PDHB | 70215 610086 | 15693 | -0.121 | 0.0997 | No | ||
| 41 | HK3 | 3190288 6510142 | 16025 | -0.168 | 0.0872 | No | ||
| 42 | DLAT | 430452 | 16052 | -0.170 | 0.0911 | No | ||
| 43 | ENO2 | 2320068 | 16609 | -0.296 | 0.0705 | No | ||
| 44 | PDHA1 | 5550397 | 17311 | -0.537 | 0.0497 | No | ||
| 45 | PFKP | 70138 6760040 1170278 | 17534 | -0.650 | 0.0583 | No |

