Profile of the Running ES Score & Positions of GeneSet Members on the Rank Ordered List
| Dataset | Set_03_truncNotch_versus_normalThy.phenotype_truncNotch_versus_normalThy.cls #truncNotch_versus_normalThy.phenotype_truncNotch_versus_normalThy.cls #truncNotch_versus_normalThy_repos |
| Phenotype | phenotype_truncNotch_versus_normalThy.cls#truncNotch_versus_normalThy_repos |
| Upregulated in class | normalThy |
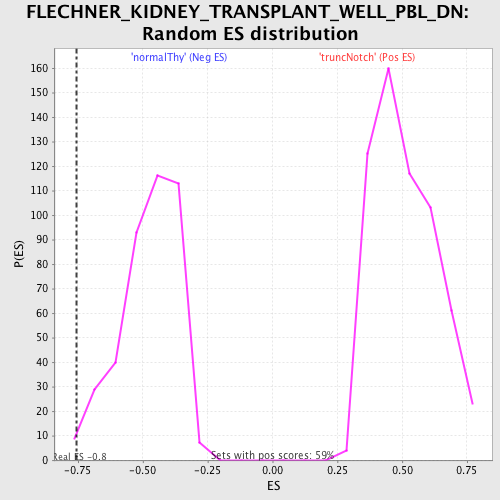
| GeneSet | FLECHNER_KIDNEY_TRANSPLANT_WELL_PBL_DN |
| Enrichment Score (ES) | -0.7549805 |
| Normalized Enrichment Score (NES) | -1.5806752 |
| Nominal p-value | 0.0073710075 |
| FDR q-value | 0.3515137 |
| FWER p-Value | 0.948 |
| PROBE | DESCRIPTION (from dataset) | GENE SYMBOL | GENE_TITLE | RANK IN GENE LIST | RANK METRIC SCORE | RUNNING ES | CORE ENRICHMENT | |
|---|---|---|---|---|---|---|---|---|
| 1 | UBE2E3 | 2030347 3840471 | 843 | 0.956 | 0.0049 | No | ||
| 2 | SLC2A3 | 1990377 | 1432 | 0.592 | 0.0043 | No | ||
| 3 | ETFA | 50347 5690040 6370044 | 2714 | 0.213 | -0.0534 | No | ||
| 4 | ABL1 | 1050593 2030050 4010114 | 3794 | 0.088 | -0.1069 | No | ||
| 5 | IAPP | 4230040 | 4924 | 0.043 | -0.1654 | No | ||
| 6 | CANX | 4760402 | 5561 | 0.030 | -0.1981 | No | ||
| 7 | LYN | 6040600 | 7952 | 0.010 | -0.3262 | No | ||
| 8 | AHR | 4560671 | 8072 | 0.009 | -0.3321 | No | ||
| 9 | BCLAF1 | 2030239 5720278 | 8550 | 0.007 | -0.3574 | No | ||
| 10 | RHEB | 6760441 | 9399 | 0.004 | -0.4028 | No | ||
| 11 | PAX8 | 5050301 5290164 | 9412 | 0.004 | -0.4033 | No | ||
| 12 | DNAJB6 | 2810309 5570451 | 11997 | -0.003 | -0.5421 | No | ||
| 13 | DDX5 | 940021 2630338 3440148 | 12466 | -0.005 | -0.5670 | No | ||
| 14 | IL1B | 2640364 | 13266 | -0.010 | -0.6095 | No | ||
| 15 | ATP6V1G1 | 3120132 | 13908 | -0.017 | -0.6431 | No | ||
| 16 | PTPN12 | 2030309 6020725 6130746 6290609 | 14883 | -0.051 | -0.6928 | No | ||
| 17 | IMPA1 | 2640093 | 15371 | -0.087 | -0.7145 | No | ||
| 18 | GADD45B | 2350408 | 15818 | -0.136 | -0.7313 | No | ||
| 19 | LY96 | 630519 | 16067 | -0.173 | -0.7356 | No | ||
| 20 | ARFGAP3 | 3390717 | 16429 | -0.244 | -0.7421 | Yes | ||
| 21 | MKNK1 | 6510161 | 16483 | -0.260 | -0.7313 | Yes | ||
| 22 | RAB11A | 5360079 | 16595 | -0.292 | -0.7220 | Yes | ||
| 23 | SQLE | 50180 940092 | 16716 | -0.326 | -0.7113 | Yes | ||
| 24 | FLI1 | 3990142 | 17232 | -0.505 | -0.7125 | Yes | ||
| 25 | ITSN2 | 780484 | 17287 | -0.525 | -0.6878 | Yes | ||
| 26 | ZBED4 | 770441 | 17386 | -0.573 | -0.6629 | Yes | ||
| 27 | MAPK14 | 5290731 | 17410 | -0.583 | -0.6336 | Yes | ||
| 28 | CD53 | 5550162 | 17560 | -0.665 | -0.6066 | Yes | ||
| 29 | NFYA | 5860368 | 17576 | -0.672 | -0.5721 | Yes | ||
| 30 | AMFR | 2810041 | 17746 | -0.774 | -0.5405 | Yes | ||
| 31 | POLS | 5890438 | 17840 | -0.842 | -0.5013 | Yes | ||
| 32 | USP7 | 3990356 | 18162 | -1.203 | -0.4554 | Yes | ||
| 33 | ANP32E | 6510706 | 18324 | -1.554 | -0.3824 | Yes | ||
| 34 | CDC42EP3 | 2480138 | 18338 | -1.617 | -0.2981 | Yes | ||
| 35 | ANXA5 | 1050373 | 18525 | -2.403 | -0.1818 | Yes | ||
| 36 | PPP1R10 | 110136 3170725 3610484 | 18605 | -3.552 | 0.0006 | Yes |