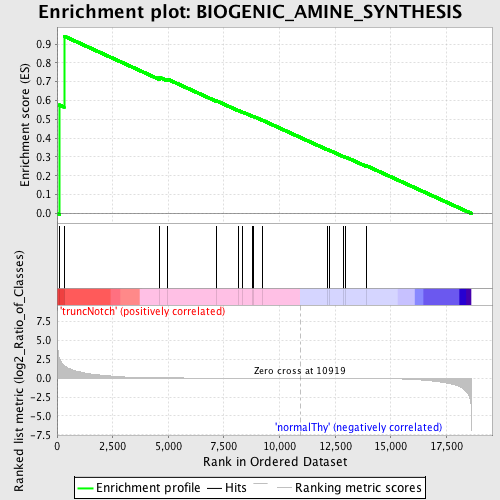
Profile of the Running ES Score & Positions of GeneSet Members on the Rank Ordered List
| Dataset | Set_03_truncNotch_versus_normalThy.phenotype_truncNotch_versus_normalThy.cls #truncNotch_versus_normalThy.phenotype_truncNotch_versus_normalThy.cls #truncNotch_versus_normalThy_repos |
| Phenotype | phenotype_truncNotch_versus_normalThy.cls#truncNotch_versus_normalThy_repos |
| Upregulated in class | truncNotch |
| GeneSet | BIOGENIC_AMINE_SYNTHESIS |
| Enrichment Score (ES) | 0.9421144 |
| Normalized Enrichment Score (NES) | 1.6048086 |
| Nominal p-value | 0.0 |
| FDR q-value | 0.07234089 |
| FWER p-Value | 0.647 |
| PROBE | DESCRIPTION (from dataset) | GENE SYMBOL | GENE_TITLE | RANK IN GENE LIST | RANK METRIC SCORE | RUNNING ES | CORE ENRICHMENT | |
|---|---|---|---|---|---|---|---|---|
| 1 | COMT | 360687 510577 5700092 | 104 | 2.579 | 0.5764 | Yes | ||
| 2 | DDC | 670408 | 313 | 1.670 | 0.9421 | Yes | ||
| 3 | SLC18A3 | 3060035 | 4614 | 0.052 | 0.7226 | No | ||
| 4 | GAD1 | 2360035 3140167 | 4956 | 0.042 | 0.7138 | No | ||
| 5 | MAOA | 1410039 4610324 | 7153 | 0.014 | 0.5988 | No | ||
| 6 | GAD2 | 1400088 | 8134 | 0.009 | 0.5481 | No | ||
| 7 | PNMT | 4210563 | 8349 | 0.008 | 0.5384 | No | ||
| 8 | TH | 2100056 | 8781 | 0.006 | 0.5166 | No | ||
| 9 | CHAT | 6840603 | 8815 | 0.006 | 0.5162 | No | ||
| 10 | DBH | 3610458 | 9242 | 0.005 | 0.4944 | No | ||
| 11 | PAH | 3800309 | 12166 | -0.004 | 0.3382 | No | ||
| 12 | AANAT | 610609 | 12257 | -0.004 | 0.3343 | No | ||
| 13 | HDC | 4150463 | 12861 | -0.007 | 0.3036 | No | ||
| 14 | ACHE | 5290750 | 12979 | -0.008 | 0.2991 | No | ||
| 15 | TPH1 | 780180 | 13910 | -0.017 | 0.2530 | No |

