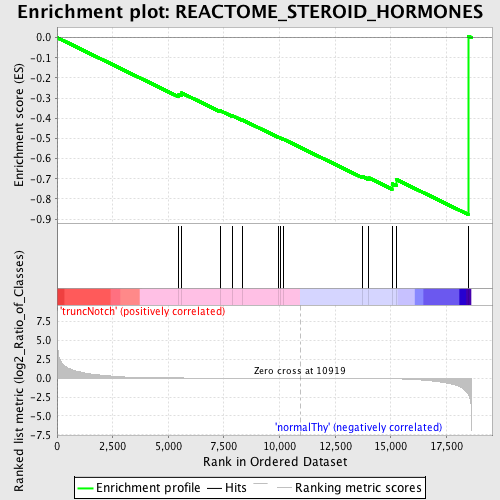
Profile of the Running ES Score & Positions of GeneSet Members on the Rank Ordered List
| Dataset | Set_03_truncNotch_versus_normalThy.phenotype_truncNotch_versus_normalThy.cls #truncNotch_versus_normalThy.phenotype_truncNotch_versus_normalThy.cls #truncNotch_versus_normalThy_repos |
| Phenotype | phenotype_truncNotch_versus_normalThy.cls#truncNotch_versus_normalThy_repos |
| Upregulated in class | normalThy |
| GeneSet | REACTOME_STEROID_HORMONES |
| Enrichment Score (ES) | -0.8773613 |
| Normalized Enrichment Score (NES) | -1.5249705 |
| Nominal p-value | 0.008350731 |
| FDR q-value | 0.34391478 |
| FWER p-Value | 0.977 |
| PROBE | DESCRIPTION (from dataset) | GENE SYMBOL | GENE_TITLE | RANK IN GENE LIST | RANK METRIC SCORE | RUNNING ES | CORE ENRICHMENT | |
|---|---|---|---|---|---|---|---|---|
| 1 | CYP2R1 | 2360010 | 5472 | 0.032 | -0.2805 | No | ||
| 2 | LRP2 | 1400204 3290706 | 5595 | 0.030 | -0.2744 | No | ||
| 3 | GC | 2850181 | 7342 | 0.012 | -0.3629 | No | ||
| 4 | CYP27B1 | 5270114 5360010 | 7880 | 0.010 | -0.3876 | No | ||
| 5 | CYP17A1 | 1340408 | 8327 | 0.008 | -0.4081 | No | ||
| 6 | CYP11B2 | 5340129 | 9944 | 0.003 | -0.4938 | No | ||
| 7 | CYP19A1 | 1850435 | 10042 | 0.003 | -0.4979 | No | ||
| 8 | CUBN | 630338 | 10165 | 0.002 | -0.5036 | No | ||
| 9 | CYP24A1 | 2340338 | 13721 | -0.015 | -0.6884 | No | ||
| 10 | HSD17B3 | 360066 4760278 | 14016 | -0.019 | -0.6960 | No | ||
| 11 | CYP11A1 | 3450037 | 15056 | -0.061 | -0.7256 | Yes | ||
| 12 | STAR | 7040670 | 15250 | -0.075 | -0.7040 | Yes | ||
| 13 | HSD11B1 | 450066 5550408 | 18477 | -2.066 | 0.0075 | Yes |

