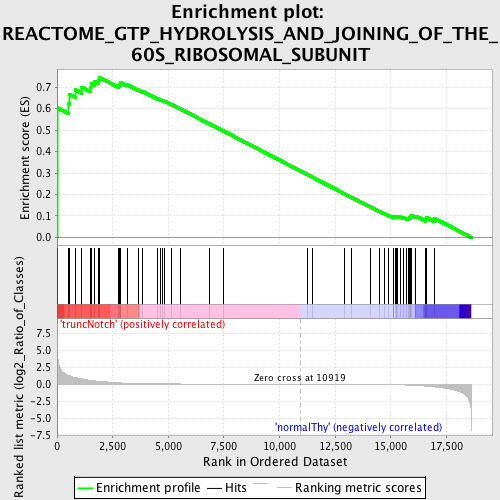
Profile of the Running ES Score & Positions of GeneSet Members on the Rank Ordered List
| Dataset | Set_03_truncNotch_versus_normalThy.phenotype_truncNotch_versus_normalThy.cls #truncNotch_versus_normalThy.phenotype_truncNotch_versus_normalThy.cls #truncNotch_versus_normalThy_repos |
| Phenotype | phenotype_truncNotch_versus_normalThy.cls#truncNotch_versus_normalThy_repos |
| Upregulated in class | truncNotch |
| GeneSet | REACTOME_GTP_HYDROLYSIS_AND_JOINING_OF_THE_60S_RIBOSOMAL_SUBUNIT |
| Enrichment Score (ES) | 0.74509346 |
| Normalized Enrichment Score (NES) | 1.5812061 |
| Nominal p-value | 0.003236246 |
| FDR q-value | 0.047340393 |
| FWER p-Value | 0.581 |
| PROBE | DESCRIPTION (from dataset) | GENE SYMBOL | GENE_TITLE | RANK IN GENE LIST | RANK METRIC SCORE | RUNNING ES | CORE ENRICHMENT | |
|---|---|---|---|---|---|---|---|---|
| 1 | RPL38 | 70040 4060138 6200601 | 1 | 8.746 | 0.3128 | Yes | ||
| 2 | RPL27A | 3130451 110195 6840494 | 3 | 8.163 | 0.6048 | Yes | ||
| 3 | EIF2S2 | 770095 2810487 | 522 | 1.296 | 0.6232 | Yes | ||
| 4 | RPS19 | 5860066 | 558 | 1.260 | 0.6664 | Yes | ||
| 5 | RPS24 | 5420377 | 816 | 0.978 | 0.6875 | Yes | ||
| 6 | RPS3A | 2470086 | 1091 | 0.785 | 0.7009 | Yes | ||
| 7 | EIF4B | 5390563 5270577 | 1494 | 0.564 | 0.6994 | Yes | ||
| 8 | RPL30 | 4810369 | 1524 | 0.553 | 0.7176 | Yes | ||
| 9 | RPL14 | 5080471 | 1699 | 0.486 | 0.7256 | Yes | ||
| 10 | RPS23 | 7100594 | 1859 | 0.437 | 0.7326 | Yes | ||
| 11 | EIF4A1 | 1990341 2810300 | 1911 | 0.425 | 0.7451 | Yes | ||
| 12 | RPS3 | 1570017 2370170 | 2759 | 0.203 | 0.7067 | No | ||
| 13 | RPL18A | 4570619 | 2806 | 0.196 | 0.7112 | No | ||
| 14 | RPS2 | 1340647 | 2836 | 0.190 | 0.7165 | No | ||
| 15 | RPS15 | 580100 | 2853 | 0.189 | 0.7224 | No | ||
| 16 | RPS17 | 2360528 | 3144 | 0.146 | 0.7120 | No | ||
| 17 | RPS15A | 1170180 | 3656 | 0.096 | 0.6879 | No | ||
| 18 | RPS4X | 2690020 | 3851 | 0.084 | 0.6804 | No | ||
| 19 | RPL37A | 7040717 | 4523 | 0.055 | 0.6462 | No | ||
| 20 | RPL4 | 2940014 5420324 | 4641 | 0.051 | 0.6418 | No | ||
| 21 | RPS13 | 1570364 | 4737 | 0.048 | 0.6384 | No | ||
| 22 | FAU | 7100465 | 4820 | 0.046 | 0.6356 | No | ||
| 23 | RPL6 | 6040735 | 5150 | 0.038 | 0.6192 | No | ||
| 24 | RPSA | 2360408 2680736 | 5533 | 0.031 | 0.5997 | No | ||
| 25 | EIF2S1 | 5360292 | 6855 | 0.016 | 0.5291 | No | ||
| 26 | RPL17 | 2690167 5690504 | 7463 | 0.012 | 0.4969 | No | ||
| 27 | RPL18 | 6380181 3870195 | 11276 | -0.001 | 0.2916 | No | ||
| 28 | EIF5B | 1190102 4200440 | 11474 | -0.002 | 0.2810 | No | ||
| 29 | RPL27 | 1940088 | 12929 | -0.008 | 0.2030 | No | ||
| 30 | RPL41 | 6940112 | 13250 | -0.010 | 0.1861 | No | ||
| 31 | RPLP1 | 3140292 | 14068 | -0.020 | 0.1428 | No | ||
| 32 | RPL37 | 3170494 3870750 4280494 | 14479 | -0.031 | 0.1218 | No | ||
| 33 | RPL35A | 2370706 | 14707 | -0.041 | 0.1110 | No | ||
| 34 | RPS21 | 3120673 | 14915 | -0.053 | 0.1018 | No | ||
| 35 | RPS28 | 3830221 | 15125 | -0.066 | 0.0929 | No | ||
| 36 | RPS29 | 580324 | 15133 | -0.066 | 0.0949 | No | ||
| 37 | RPS20 | 1740092 | 15135 | -0.066 | 0.0972 | No | ||
| 38 | RPS14 | 430541 | 15223 | -0.073 | 0.0951 | No | ||
| 39 | RPS16 | 510722 | 15242 | -0.074 | 0.0968 | No | ||
| 40 | RPL8 | 20296 | 15246 | -0.075 | 0.0993 | No | ||
| 41 | RPLP2 | 5290020 | 15294 | -0.080 | 0.0996 | No | ||
| 42 | RPL39 | 2370446 | 15430 | -0.093 | 0.0957 | No | ||
| 43 | EIF4E | 1580403 70133 6380215 | 15566 | -0.108 | 0.0923 | No | ||
| 44 | RPL28 | 6900136 | 15706 | -0.123 | 0.0892 | No | ||
| 45 | RPL5 | 840095 | 15789 | -0.133 | 0.0895 | No | ||
| 46 | RPS5 | 580093 | 15829 | -0.138 | 0.0924 | No | ||
| 47 | RPS11 | 4120403 | 15895 | -0.148 | 0.0942 | No | ||
| 48 | RPL19 | 5550592 | 15897 | -0.148 | 0.0994 | No | ||
| 49 | RPS25 | 520139 | 15910 | -0.149 | 0.1041 | No | ||
| 50 | EIF4G1 | 4070446 | 16118 | -0.180 | 0.0994 | No | ||
| 51 | RPL11 | 3780435 | 16558 | -0.279 | 0.0857 | No | ||
| 52 | EIF4H | 610324 | 16613 | -0.297 | 0.0934 | No | ||
| 53 | EIF5 | 6380750 | 16967 | -0.403 | 0.0888 | No |

