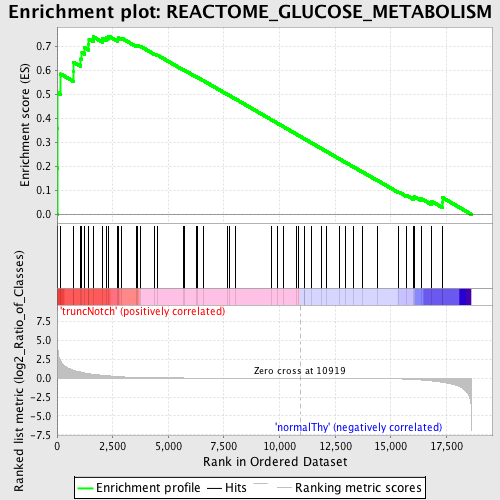
Profile of the Running ES Score & Positions of GeneSet Members on the Rank Ordered List
| Dataset | Set_03_truncNotch_versus_normalThy.phenotype_truncNotch_versus_normalThy.cls #truncNotch_versus_normalThy.phenotype_truncNotch_versus_normalThy.cls #truncNotch_versus_normalThy_repos |
| Phenotype | phenotype_truncNotch_versus_normalThy.cls#truncNotch_versus_normalThy_repos |
| Upregulated in class | truncNotch |
| GeneSet | REACTOME_GLUCOSE_METABOLISM |
| Enrichment Score (ES) | 0.74310595 |
| Normalized Enrichment Score (NES) | 1.5754125 |
| Nominal p-value | 0.003327787 |
| FDR q-value | 0.05182953 |
| FWER p-Value | 0.631 |
| PROBE | DESCRIPTION (from dataset) | GENE SYMBOL | GENE_TITLE | RANK IN GENE LIST | RANK METRIC SCORE | RUNNING ES | CORE ENRICHMENT | |
|---|---|---|---|---|---|---|---|---|
| 1 | PGK1 | 1570494 630300 | 11 | 5.024 | 0.1934 | Yes | ||
| 2 | TPI1 | 1500215 2100154 | 25 | 4.295 | 0.3584 | Yes | ||
| 3 | BSG | 2900193 6520053 | 35 | 3.844 | 0.5063 | Yes | ||
| 4 | PKM2 | 6520403 70500 | 160 | 2.217 | 0.5852 | Yes | ||
| 5 | SLC25A1 | 4050402 | 735 | 1.043 | 0.5946 | Yes | ||
| 6 | GOT2 | 4570164 5220450 | 742 | 1.035 | 0.6342 | Yes | ||
| 7 | GYG1 | 460746 1450138 | 1066 | 0.801 | 0.6477 | Yes | ||
| 8 | GOT1 | 2940465 | 1116 | 0.771 | 0.6748 | Yes | ||
| 9 | MDH2 | 1850601 | 1242 | 0.693 | 0.6949 | Yes | ||
| 10 | SLC25A11 | 130097 770685 | 1426 | 0.595 | 0.7080 | Yes | ||
| 11 | SLC2A3 | 1990377 | 1432 | 0.592 | 0.7305 | Yes | ||
| 12 | PHKG2 | 2640148 | 1625 | 0.516 | 0.7401 | Yes | ||
| 13 | NUP93 | 2190273 | 2035 | 0.385 | 0.7329 | Yes | ||
| 14 | RAE1 | 7050121 | 2206 | 0.341 | 0.7370 | Yes | ||
| 15 | NUP62 | 1240128 | 2317 | 0.313 | 0.7431 | Yes | ||
| 16 | SLC2A1 | 2100609 | 2733 | 0.208 | 0.7288 | No | ||
| 17 | NUP43 | 3360482 | 2751 | 0.205 | 0.7358 | No | ||
| 18 | NUPL2 | 6550537 | 2914 | 0.177 | 0.7339 | No | ||
| 19 | PYGL | 7160520 | 3552 | 0.105 | 0.7036 | No | ||
| 20 | PFKFB2 | 3940538 7100059 | 3612 | 0.099 | 0.7043 | No | ||
| 21 | G6PC | 430093 | 3730 | 0.091 | 0.7015 | No | ||
| 22 | NUP155 | 5720576 6220114 | 4389 | 0.058 | 0.6683 | No | ||
| 23 | SLC2A2 | 5130537 5720722 6770079 | 4512 | 0.055 | 0.6638 | No | ||
| 24 | FBP2 | 1580193 | 5674 | 0.029 | 0.6024 | No | ||
| 25 | HK1 | 4280402 | 5714 | 0.028 | 0.6014 | No | ||
| 26 | CALM1 | 380128 | 6258 | 0.021 | 0.5729 | No | ||
| 27 | DLD | 4150403 6590341 | 6307 | 0.020 | 0.5711 | No | ||
| 28 | PFKFB1 | 2370128 | 6587 | 0.018 | 0.5568 | No | ||
| 29 | PDHX | 870315 | 7651 | 0.011 | 0.4999 | No | ||
| 30 | PCK1 | 7000358 | 7742 | 0.010 | 0.4955 | No | ||
| 31 | PGM1 | 3840408 | 8013 | 0.009 | 0.4813 | No | ||
| 32 | GCKR | 4070035 | 9643 | 0.004 | 0.3937 | No | ||
| 33 | GYS1 | 540154 | 9913 | 0.003 | 0.3793 | No | ||
| 34 | PYGM | 3940300 | 10159 | 0.002 | 0.3662 | No | ||
| 35 | GYS2 | 2570736 | 10777 | 0.000 | 0.3330 | No | ||
| 36 | NUP188 | 1190470 | 10849 | 0.000 | 0.3292 | No | ||
| 37 | GBE1 | 2190368 | 11104 | -0.001 | 0.3155 | No | ||
| 38 | TPR | 1990066 6550390 | 11115 | -0.001 | 0.3150 | No | ||
| 39 | NUP35 | 5340408 | 11413 | -0.001 | 0.2990 | No | ||
| 40 | SLC2A4 | 540441 | 11888 | -0.003 | 0.2736 | No | ||
| 41 | NUP153 | 7000452 | 12121 | -0.004 | 0.2613 | No | ||
| 42 | PHKG1 | 2570152 | 12676 | -0.006 | 0.2317 | No | ||
| 43 | MDH1 | 6660358 6760731 | 12968 | -0.008 | 0.2163 | No | ||
| 44 | RANBP2 | 4280338 | 13323 | -0.011 | 0.1976 | No | ||
| 45 | NUP54 | 940546 2360156 4060278 | 13723 | -0.015 | 0.1767 | No | ||
| 46 | PHKA2 | 610035 1090044 | 14401 | -0.028 | 0.1413 | No | ||
| 47 | NUP37 | 2370097 6370435 6380008 | 15360 | -0.086 | 0.0930 | No | ||
| 48 | PDHB | 70215 610086 | 15693 | -0.121 | 0.0798 | No | ||
| 49 | HK3 | 3190288 6510142 | 16025 | -0.168 | 0.0685 | No | ||
| 50 | DLAT | 430452 | 16052 | -0.170 | 0.0737 | No | ||
| 51 | NUP160 | 1990551 | 16359 | -0.229 | 0.0660 | No | ||
| 52 | NUP107 | 6380021 | 16837 | -0.359 | 0.0542 | No | ||
| 53 | PDHA1 | 5550397 | 17311 | -0.537 | 0.0495 | No | ||
| 54 | PFKFB3 | 630706 | 17316 | -0.539 | 0.0700 | No |

